
Our 2025 poverty prediction, graded
PolicyEngine registered a 2025 SPM poverty prediction before the Census release: up 0.2 points overall, up 0.9 for children, down 0.5 for people 65 and over. Census reported +0.1, −0.1 and +0.2. The grade, and where the misses came from: the model grew Social Security, pensions and self-employment income per person at national rates. Rerunning it with rates closer to the survey's removes most of the senior miss and about a third of the child miss.
Contents
The grade
Where the misses came from
Which growth rates mattered
How the number was built
How PolicyEngine calculates SPM poverty
What the model does not do
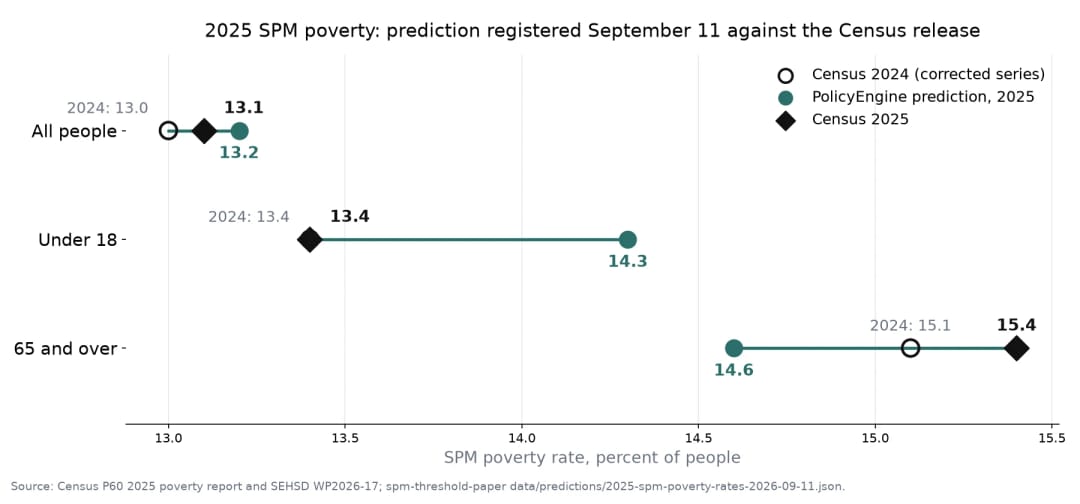
On September 11 we registered a prediction1 of the 2025 Supplemental Poverty Measure (SPM) poverty rates that the Census Bureau would publish four days later: 13.2 percent of all people, up 0.2 points from 2024; 14.3 percent of children, up 0.9; and 14.6 percent of people 65 and over, down 0.5. Census reported 13.1 percent, 13.4 percent and 15.4 percent: up 0.1, down 0.1 and up 0.2. The prediction came within 0.1 point for all people, and it missed by 0.9 points for children and 0.8 points for people 65 and over, in opposite directions.
A companion post covers the release itself, including the rates by state and housing tenure.
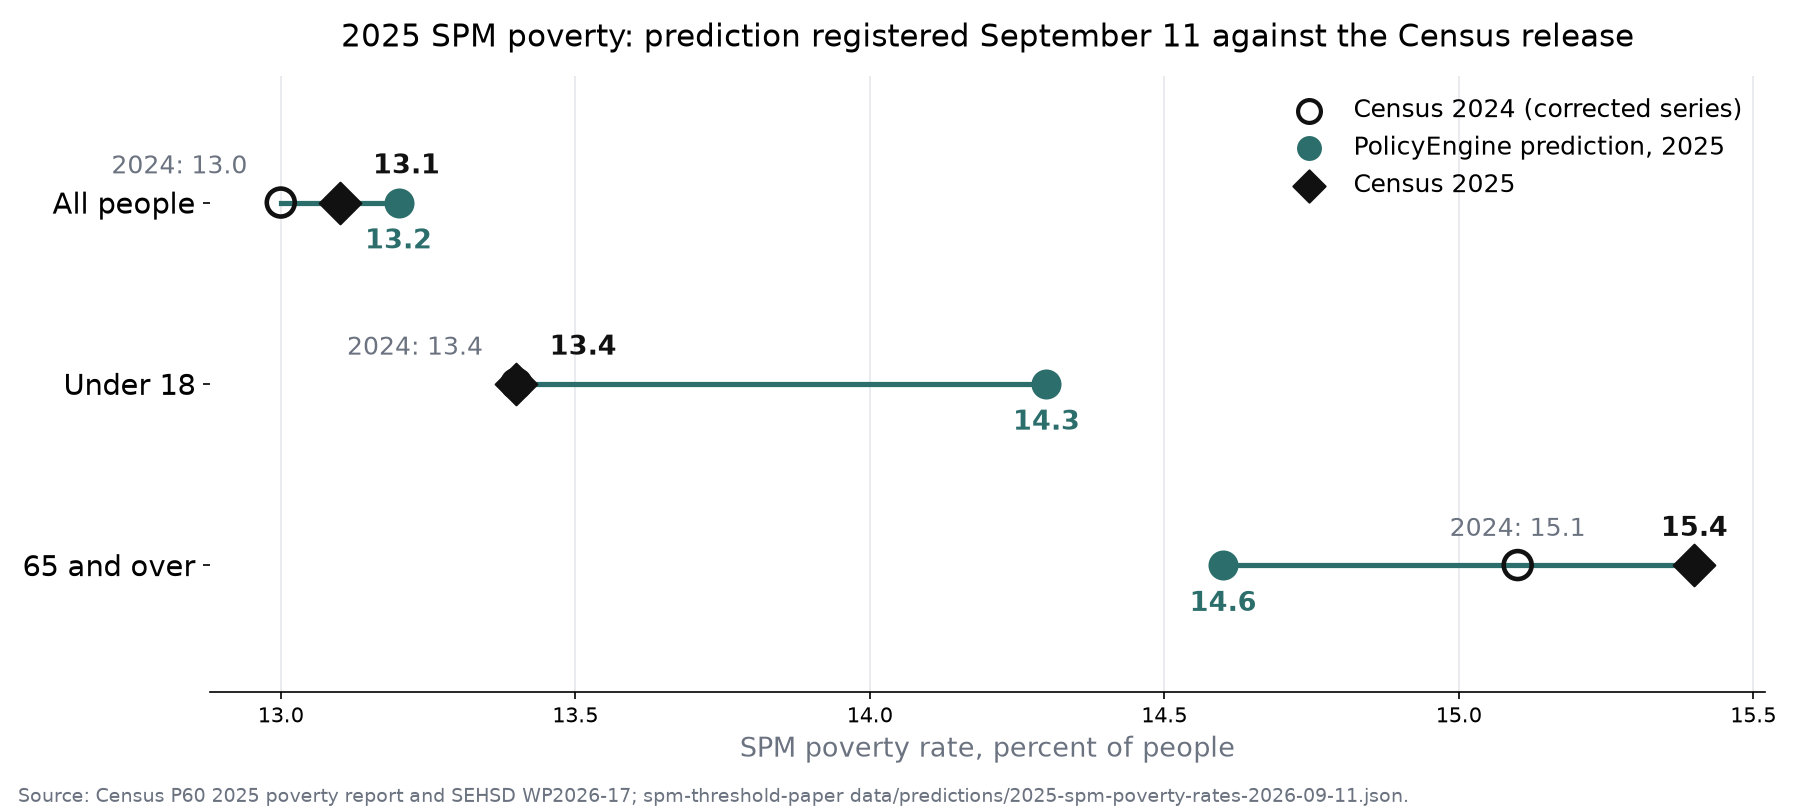 2025 SPM poverty: the prediction registered September 11 against the Census release
The grade#
We committed to grading the prediction against the published change for each group. Census re-based its 2024 rates to new population controls in this release, which moved the 2024 child rate from 13.4 to 13.5 percent (Table 4), so the changes below use Census's own 2024 and 2025 figures, to two decimals from Table 5.
Census marks none of the three changes as statistically different from zero at the 90 percent level. Table 4 puts the 90 percent margin of error on the 2025 rates at 0.3 points for all people, 0.6 for children and 0.5 for people 65 and over. The child and senior misses exceed those margins; the all-people miss sits inside its margin.
The prior-model columns come from the model that served policyengine.org when we registered the prediction, which aged the 2024 thresholds by consumer price inflation.2 It came closer than the new model for children and further off for all people and for people 65 and over.
Where the misses came from#
Two things move a poverty rate between years: the thresholds, and the resources that families, or SPM units, have to compare with them. BLS raised the 2025 thresholds by 4.4 to 6.3 percent depending on housing tenure (BLS), while the official poverty line rose 2.6 percent with consumer prices (Table 10). To separate the two, we ran 2025 a second time with the thresholds held at their 2024 values plus 2.6 percent. Threshold growth accounts for the gap between the two 2025 runs, and resource growth for the gap between the constant-threshold run and 2024. The companion post applies the same split to the 2026 CPS ASEC file, the survey behind the Census figures.
For children the model erred the same way on both parts. Threshold growth pulled 1.40 points of children into poverty in the model against 1.09 in the survey, and resource growth lifted 0.54 points out against 1.15. For people 65 and over both errors ran the other way: thresholds added 0.27 points in the model against 0.71, and resources removed 0.79 against 0.47. For all people the two errors partly offset.
The threshold columns count people whose 2025 resources fall between the old line, carried forward with inflation, and the new one. The same rise in the thresholds catches fewer people 65 and over in the model than in the survey: the model has fewer seniors just under the line. It catches more children as well, though that gap shrinks when the model grows self-employment income with wages.7 The model's poverty levels also differ from Census: 16.6 percent of children and 10.9 percent of people 65 and over in 2025, against 13.4 and 15.4.
The resource columns measure what changed in families' resources at a fixed real line. Among people whose 2024 resources fell between 75 and 150 percent of their threshold, the model raised the median SPM unit's resources by 4.6 percent into 2025: 3.7 percent for children and 7.7 percent for people 65 and over.3 In the 2025 CPS ASEC file, which covers calendar 2024, one common growth rate applied to every unit's resources reproduces Census's 2025 figure at 4.9 percent for all people, 5.5 percent for children and 4.1 percent for people 65 and over.3 The two are different statistics, a median for the same units and a common rate for a cross-section, so they show the direction of the gap by age group and not its size. The model gave children less resource growth than seniors; the survey's figures imply the reverse.
The new $6,000 deduction for people 65 and over explains little of the modeled fall among seniors. Rerunning 2025 with the deduction set to zero raises the modeled poverty rate for people 65 and over by 0.012 points, about 7,700 people.3 The deduction cuts income tax for 44 percent of people 65 and over in the model, and for 8 percent of those with resources below 125 percent of their threshold.
A simpler forecast would have done better this year. Taking the 2025 CPS ASEC file, moving its thresholds to the 2025 BLS values and growing every unit's resources by the model's overall 4.6 percent gives 13.2, 13.7 and 15.2 percent: misses of 0.1, 0.3 and −0.1 points. We ran this check after the release, and the growth rate comes from the model, so it is a diagnostic rather than a second forecast. Survey-reported taxes and benefits also cannot respond to a change in law; the model computes them from the rules so that they can. The error sits in the model's population near the line and in how its resources grow from 2024 to 2025.
Which growth rates mattered#
The model carries each 2024 record to 2025 by multiplying its income by the growth of a national total. For three sources, that differs from what people in the survey saw:
- Social Security. The total the model uses rose 8.3 percent, so every beneficiary's benefit rose 8.3 percent. The cost-of-living adjustment was 2.5 percent, and in the survey benefits per recipient 66 and over rose 4.0 percent at the 2024 age mix.
- Pensions and retirement distributions rose 19.5 percent per person, with CBO's projection of taxable pension income. In the survey, pensions and annuities per recipient 65 and over rose 3.7 percent at the median.
- Self-employment income fell 5.8 percent per person, with CBO's projection of business income. In the survey it rose 8.7 percent at the median.
Wages rose 4.9 percent for every worker, and in the survey wages grew at about the same rate at every wage level. Ranked instead by family resources relative to the threshold, the bottom tenth of earners saw 6.6 percent, but that difference is within the survey's sampling error.
We reran 2025 with Social Security at the cost-of-living adjustment or the survey's 4.0 percent, pensions at consumer price inflation and self-employment income growing with wages, and, as a sensitivity check, with wages growing by the survey's rate for each tenth of family resources.7
Changing the three sources cuts the child miss by about a third, from 0.92 points to 0.6, and the senior miss from 0.76 points to between 0.09 and 0.26, depending on the Social Security rate. At the survey's 4.0 percent, the resource column for people 65 and over matches the survey (−0.43 against −0.47), and what remains is on the threshold side: the model still has fewer seniors just under the line. The smaller miss at the cost-of-living adjustment comes from slower resource growth offsetting that gap. Growing wages by family resources would lower the child change further, to +0.42 with the three changes, but it rests on differences within sampling error. For all people, the three changes leave the change 0.1 to 0.2 points above Census, about where the registered prediction was, so the close all-people result owed something to errors that offset.
For children, about 0.6 points remain. One candidate no growth rate can reproduce: in the survey, the share of children living with a noncitizen fell from 17.9 to 16.4 percent, which at 2024 poverty rates lowers child poverty by about 0.2 points. The change could reflect who answered the survey as well as who lives in the country. Census marks none of its changes as statistically significant, so these reruns show which assumptions matter, not their right values.
How the number was built#
The prediction is the Census 2024 rate plus PolicyEngine's modeled change from 2024 to 2025.4 We do not publish the model's own level as the prediction, because the level differs from Census by construction: the model computes benefits from program rules instead of taking reported amounts, fits its population weights to administrative totals, and projects 2024 households forward rather than surveying 2025 ones. None of the 5,659 calibration targets5 is a poverty rate, so the Census release tests the model on a quantity it was never fitted to.
The 2024 anchors are the corrected series in Census's August working paper, issued after BLS revised the thresholds. On the original series the anchors are 12.9, 13.4 and 15.0, and the predictions round to 13.1, 14.3 and 14.5.
How PolicyEngine calculates SPM poverty#
A person is in poverty when their SPM unit's resources fall below its threshold. Three parts feed that comparison.
Population. The Microcosm US dataset6 holds 57,240 Current Population Survey households with 166,321 people. Their weights are fitted to 5,659 administrative targets: IRS income statistics by state and income level, Census population estimates by age and sex, Medicaid and Marketplace enrollment, SNAP participation and benefits, SSI, TANF, state tax collections and national accounts, among others. The model carries the 2024 survey values to 2025 by multiplying each record's amounts by the growth of a national total: IRS income totals carried forward with CBO and SSA figures for wages, self-employment income, pensions and Social Security; CMS per-capita spending for medical expenses; and Census population totals for the weights. Household composition stays as surveyed in 2024.
Thresholds. The SPM threshold calculator supplies each unit's threshold from the published BLS 2025 national values and housing shares, the three-parameter equivalence scale, and a rent index for the unit's metro or nonmetro area. The 2025 rent indices were projections when we ran the model; Census published the 2025 geographic adjustments with the survey file in September.
Resources. Market income, Social Security, unemployment compensation, workers' compensation and child support received come from the survey record. The model computes SSI, SNAP, WIC, school meals, TANF and housing subsidies from program rules, for eligible units that the dataset marks as taking them up, and caps the housing subsidy at the housing portion of the threshold less the tenant's payment. It computes payroll, federal and state income taxes from statute, then subtracts child support paid, medical out-of-pocket expenses, and work and child care expenses capped by earnings.
The full description, with every variable named and linked, is in the PolicyEngine US methodology documentation.
What the model does not do#
- Medicaid does not change non-premium medical spending. The model computes Medicaid eligibility and enrollment, and it computes premiums from rules for Medicare, Marketplace coverage and CHIP. Non-premium medical spending is a survey input uprated with CMS per-capita spending. Enrolling someone in Medicaid, or removing their coverage, leaves that spending unchanged, so coverage changes reach poverty only through the premium components.
- Other premiums stay as reported, including the employee share of employer plans.
- Levels. The model's own 2025 level is 13.2 percent for all people, 16.6 for children and 10.9 for people 65 and over. The child and senior levels sit far from Census in opposite directions, so we report changes. We treat those gaps as open questions.
- Local thresholds for 2025 were projections at the time of the prediction.
-
The prediction file, its hash and an OpenTimestamps proof sit unchanged in the spm-threshold-paper repository, with a dated grade beside them: prediction, timestamp proof, grade. ↩
-
policyengine-us 1.764.6; the registered file records its changes. ↩
-
The uprating analysis splits near-line resource growth by income source, reruns 2025 with each replacement growth rate on the same packages and population, and compares growth with the 2025 and 2026 CPS ASEC files: results by run, survey growth and wage growth by decile. Survey comparisons are between two cross-sections, and the replacement rates are reference rates, not estimates of the right growth for each person. ↩ ↩2
-
Results files: near-line resource growth, raw-survey aging, and the senior-deduction counterfactual, which sets the deduction amount to zero. ↩ ↩2 ↩3
-
The modeled changes come from development runs on policyengine-core 3.30.1. A rerun on the released packages (policyengine-us 2.2.1, policyengine-core 3.32.5 and spm-calculator 1.0.0, the versions policyengine 6.0.0 pins) reproduced all three changes to within 0.000001 points, so the amendment rule in the registered file, a dated amendment if any change moved by 0.05 points or more, did not trigger. ↩
-
Calibration diagnostics for the population release. ↩
-
The grade record, the population runs, the constant-threshold rerun, the senior-deduction counterfactual and the raw-survey aging check are in
analysis/prediction-grade-2025of the spm-threshold-paper repository, with a README that lists the commands. The runs use policyengine 6.0.0 and the Microcosm US population release populace-us-2024-spm-20260909. ↩

PolicyEngine's Co-founder and CEO