
2025 Supplemental Poverty Measure: what Census reported, and what threshold growth did to it
Census reported 13.1 percent SPM poverty in 2025, up 0.1 point from 2024. We show the rate by age, housing tenure, and state, and find it would have fallen 0.7 points if thresholds rose with inflation.

Contents
What an SPM threshold is
By age
By housing tenure
By state
At 2024 thresholds
On September 15 the Census Bureau published Poverty in the United States: 2025. The Supplemental Poverty Measure rate for 2025 is 13.1 percent, 44.4 million people, up 0.1 point from 2024, a change Census describes as not statistically different from zero. Children's SPM poverty is 13.4 percent, down 0.1, and people 65 and over are at 15.4 percent, up 0.2 (Table 4). The official poverty rate fell 0.5 points to 10.2 percent (Table 1).
The thresholds that define SPM poverty rose 4.4 to 6.3 percent in 2025, while CPI-U rose 2.6 percent. Resources near the poverty line grew fast enough to offset most of that increase. At 2024 thresholds grown by CPI-U, the 2025 SPM rate is 12.3 percent, down 0.7 points.
What an SPM threshold is#
The SPM counts a person as poor when their SPM unit's resources fall below its threshold. Census builds resources from cash income plus in-kind benefits such as SNAP, school meals, housing assistance and energy assistance, then subtracts taxes, work and child care expenses, child support paid and medical out-of-pocket spending. The threshold represents the cost of food, clothing, shelter, utilities, telephone and internet.
BLS produces the thresholds from the Consumer Expenditure Survey. It takes five years of spending data, lagged one year, from families with children, converts each family's spending to that of a reference family of two adults and two children, and brings every quarter to threshold-year dollars with a price index built from the threshold's own components. It then averages spending on those items among families between the 47th and 53rd percentiles, adds 20 percent for other basic goods and services such as household supplies, personal care and non-work transportation, substitutes each tenure group's own shelter and utility spending, and takes 82 percent of the result. The 82 percent replaced 83 percent when BLS corrected the 2019 to 2024 series in July 2026.
Shelter costs differ by housing situation, so BLS publishes three thresholds. For 2025 they are $41,701 for renters, $41,323 for owners with a mortgage and $34,326 for owners without one, up 6.3, 5.3 and 4.4 percent from 2024.1 BLS attributes part of the growth to prices: the index for the threshold's components rose 3.4 percent in 2025, against 2.6 percent for CPI-U. The remainder reflects the spending data, as the five-year window moved forward a year.
Census adapts the national threshold to each family. A three-parameter equivalence scale adjusts it for the number of adults and children, and a geographic adjustment moves the housing share with local rents, using five-year American Community Survey median rents for two-bedroom units in 341 metropolitan and nonmetropolitan areas (technical documentation, section 4.2). Our SPM threshold calculator applies the same steps to any family and area.
The base moves with what families spend in real terms, so the threshold rises when middle-income families spend more on necessities even if prices hold still. Census updates the official poverty thresholds by CPI-U alone: the 2025 official threshold for two adults and two children is $32,649, up 2.6 percent from $31,812 (Table 11).
By age#
Census prints rates for children, adults 18 to 64 and people 65 and over. The table adds finer age groups from the public-use microdata.2
Children under 6 have higher rates than older children, and people 75 and over have the highest rate of any group. The point estimate for children under 4 fell 0.8 points, with standard errors of 0.6 points on each year's figure, and the rate for children 6 to 17 rose 0.2. Census restated 2024 on Vintage 2025 population controls in this report, which moves the 2024 child rate to 13.5 from the 13.4 in its August working paper.
By housing tenure#
A family's tenure selects which of the three thresholds applies to it, and the renter threshold grew fastest this year. Census reports renters at 24.0 percent in 2025, up 0.8 points; owners with a mortgage at 6.0 percent, down 0.2; and owners without a mortgage at 11.9 percent, unchanged (Table 4).
By state#
Census publishes state rates as three-year averages, because a single year of the Current Population Survey is too small a sample for most states. The 2023 to 2025 average for all people ranges from 6.4 percent in Maine to 19.0 percent in Louisiana, with California at 17.8, Mississippi at 16.8 and Florida at 16.4 (Table 17).
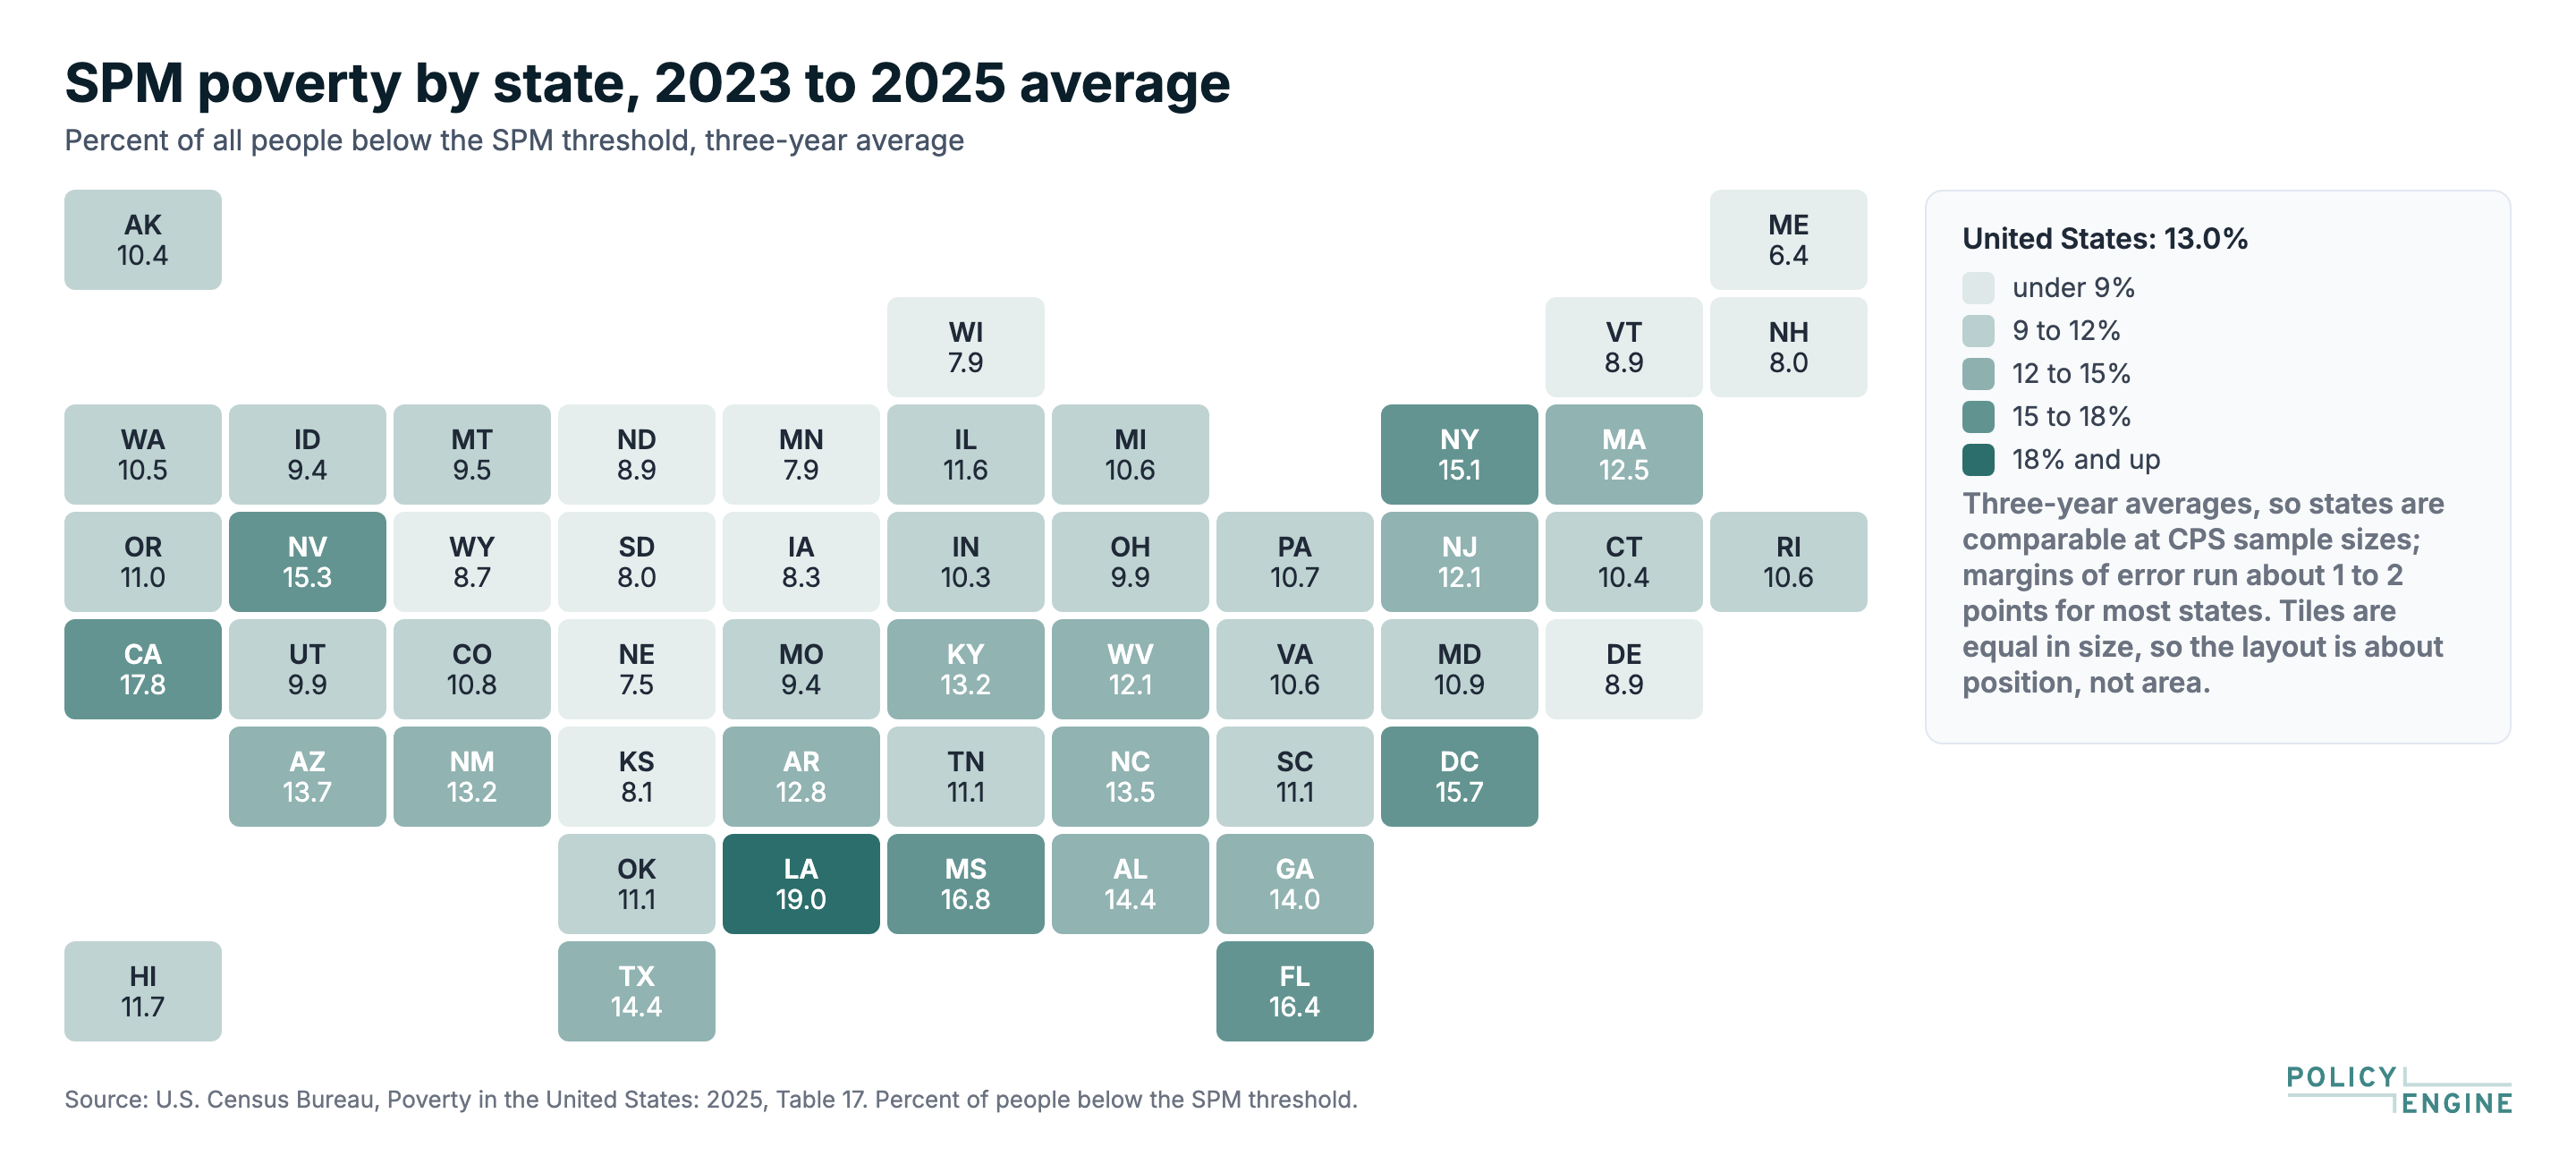 SPM poverty by state, 2023 to 2025 average
At 2024 thresholds#
We recomputed the 2025 rates with the national thresholds held at their 2024 values grown by CPI-U, tenure group by tenure group, leaving the equivalence scale, the geographic adjustment and every unit's resources at their published 2025 values.3 A unit is poor when its resources fall below the anchored threshold.
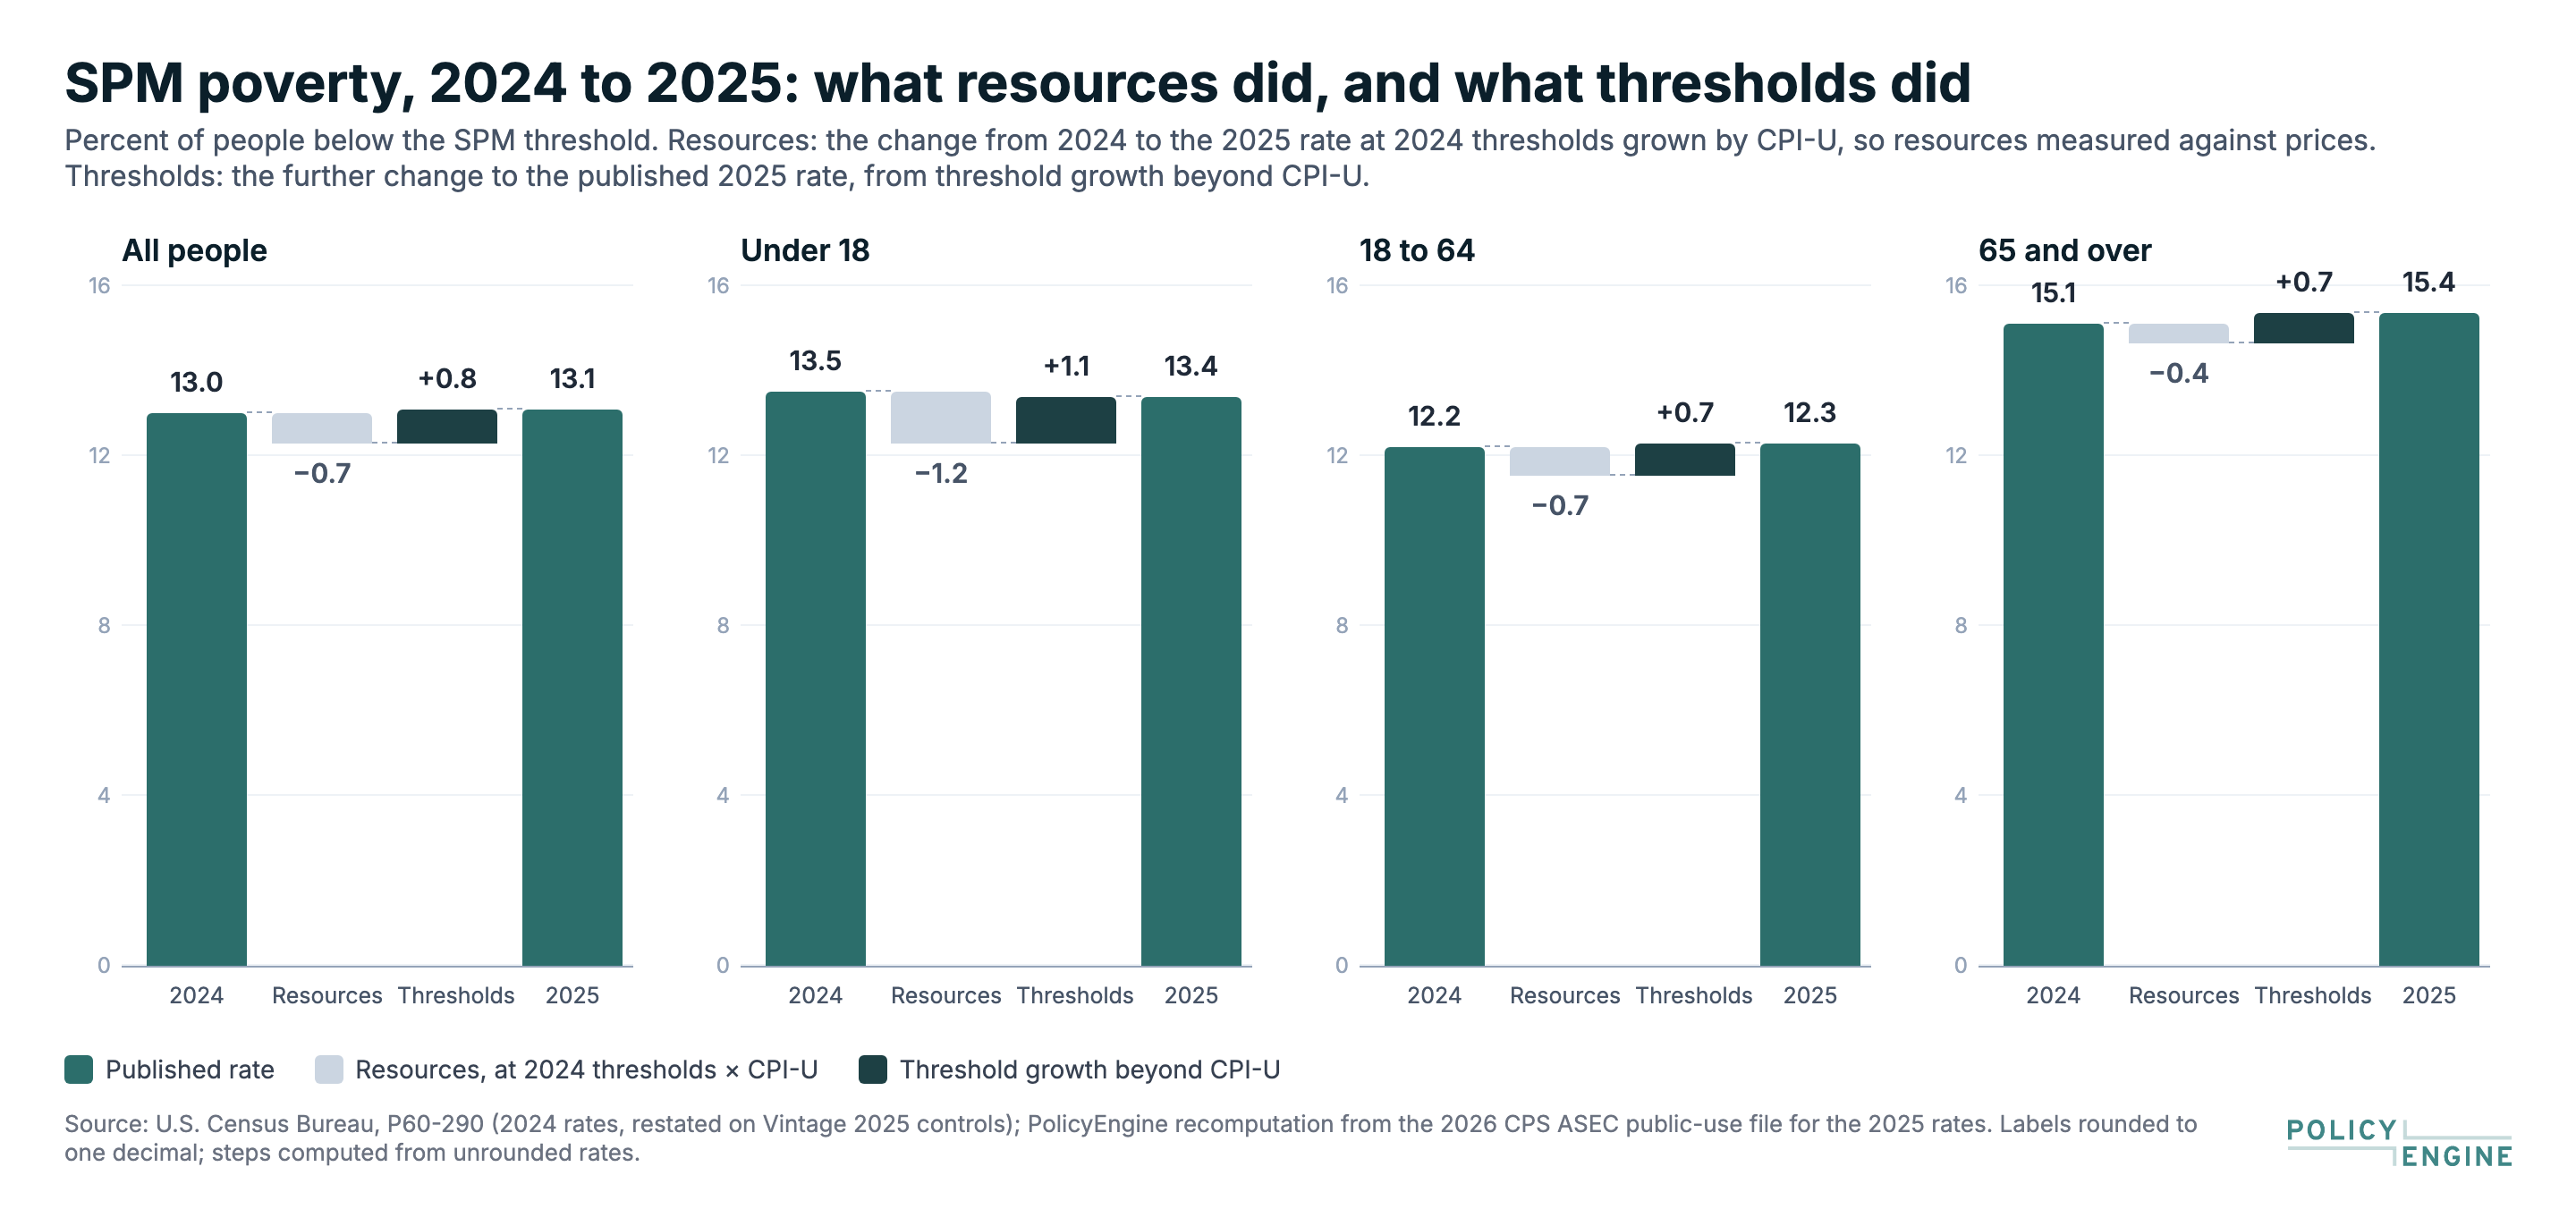 SPM poverty from 2024 to 2025 for all people, children, adults 18 to 64 and people 65 and over: the 2024 rate, the change in resources measured against prices, the change from threshold growth beyond CPI-U, and the published 2025 rate
Threshold growth beyond CPI-U accounts for 0.80 points of the 2025 rate for all people, 1.08 points for children, 0.73 for people 18 to 64 and 0.72 for people 65 and over. On the anchored basis, SPM poverty fell from 13.0 percent in 2024 to 12.3 in 2025, and child poverty fell from 13.5 to 12.3. The youngest children carry the largest effect: 1.23 points (±0.20) for children under 4 and 1.20 (±0.17) for children under 6, against 1.03 (±0.12) for ages 6 to 17 and 0.75 (±0.10) for people 75 and over.
The renter threshold rose 6.3 percent, the most of the three tenure groups, and the renter poverty rate is 23.96 percent as published against 22.13 anchored. Owners without a mortgage, whose threshold rose 4.4 percent, go from 11.89 to 11.49. Owners with a mortgage go from 6.00 to 5.67.
The chained variant grows the 2024 thresholds by C-CPI-U, 2.48 percent, and lands within 0.04 points of the CPI-U figures.4
By state, the threshold effect ranges from zero in Nebraska to 1.7 points in Alabama, and it exceeds twice its standard error in 28 of the 51 states. New York (1.5 points), Montana (1.5), Indiana (1.4), Delaware (1.4) and Arizona (1.4) follow Alabama; Maine, Kansas, Washington, Minnesota and Wisconsin sit at 0.2 points or less. The effect counts the people whose resources fall between the anchored threshold and the published one, so it depends on how many of a state's residents sit in that band. These are single-year estimates, with standard errors of 0.1 to 0.7 points.3
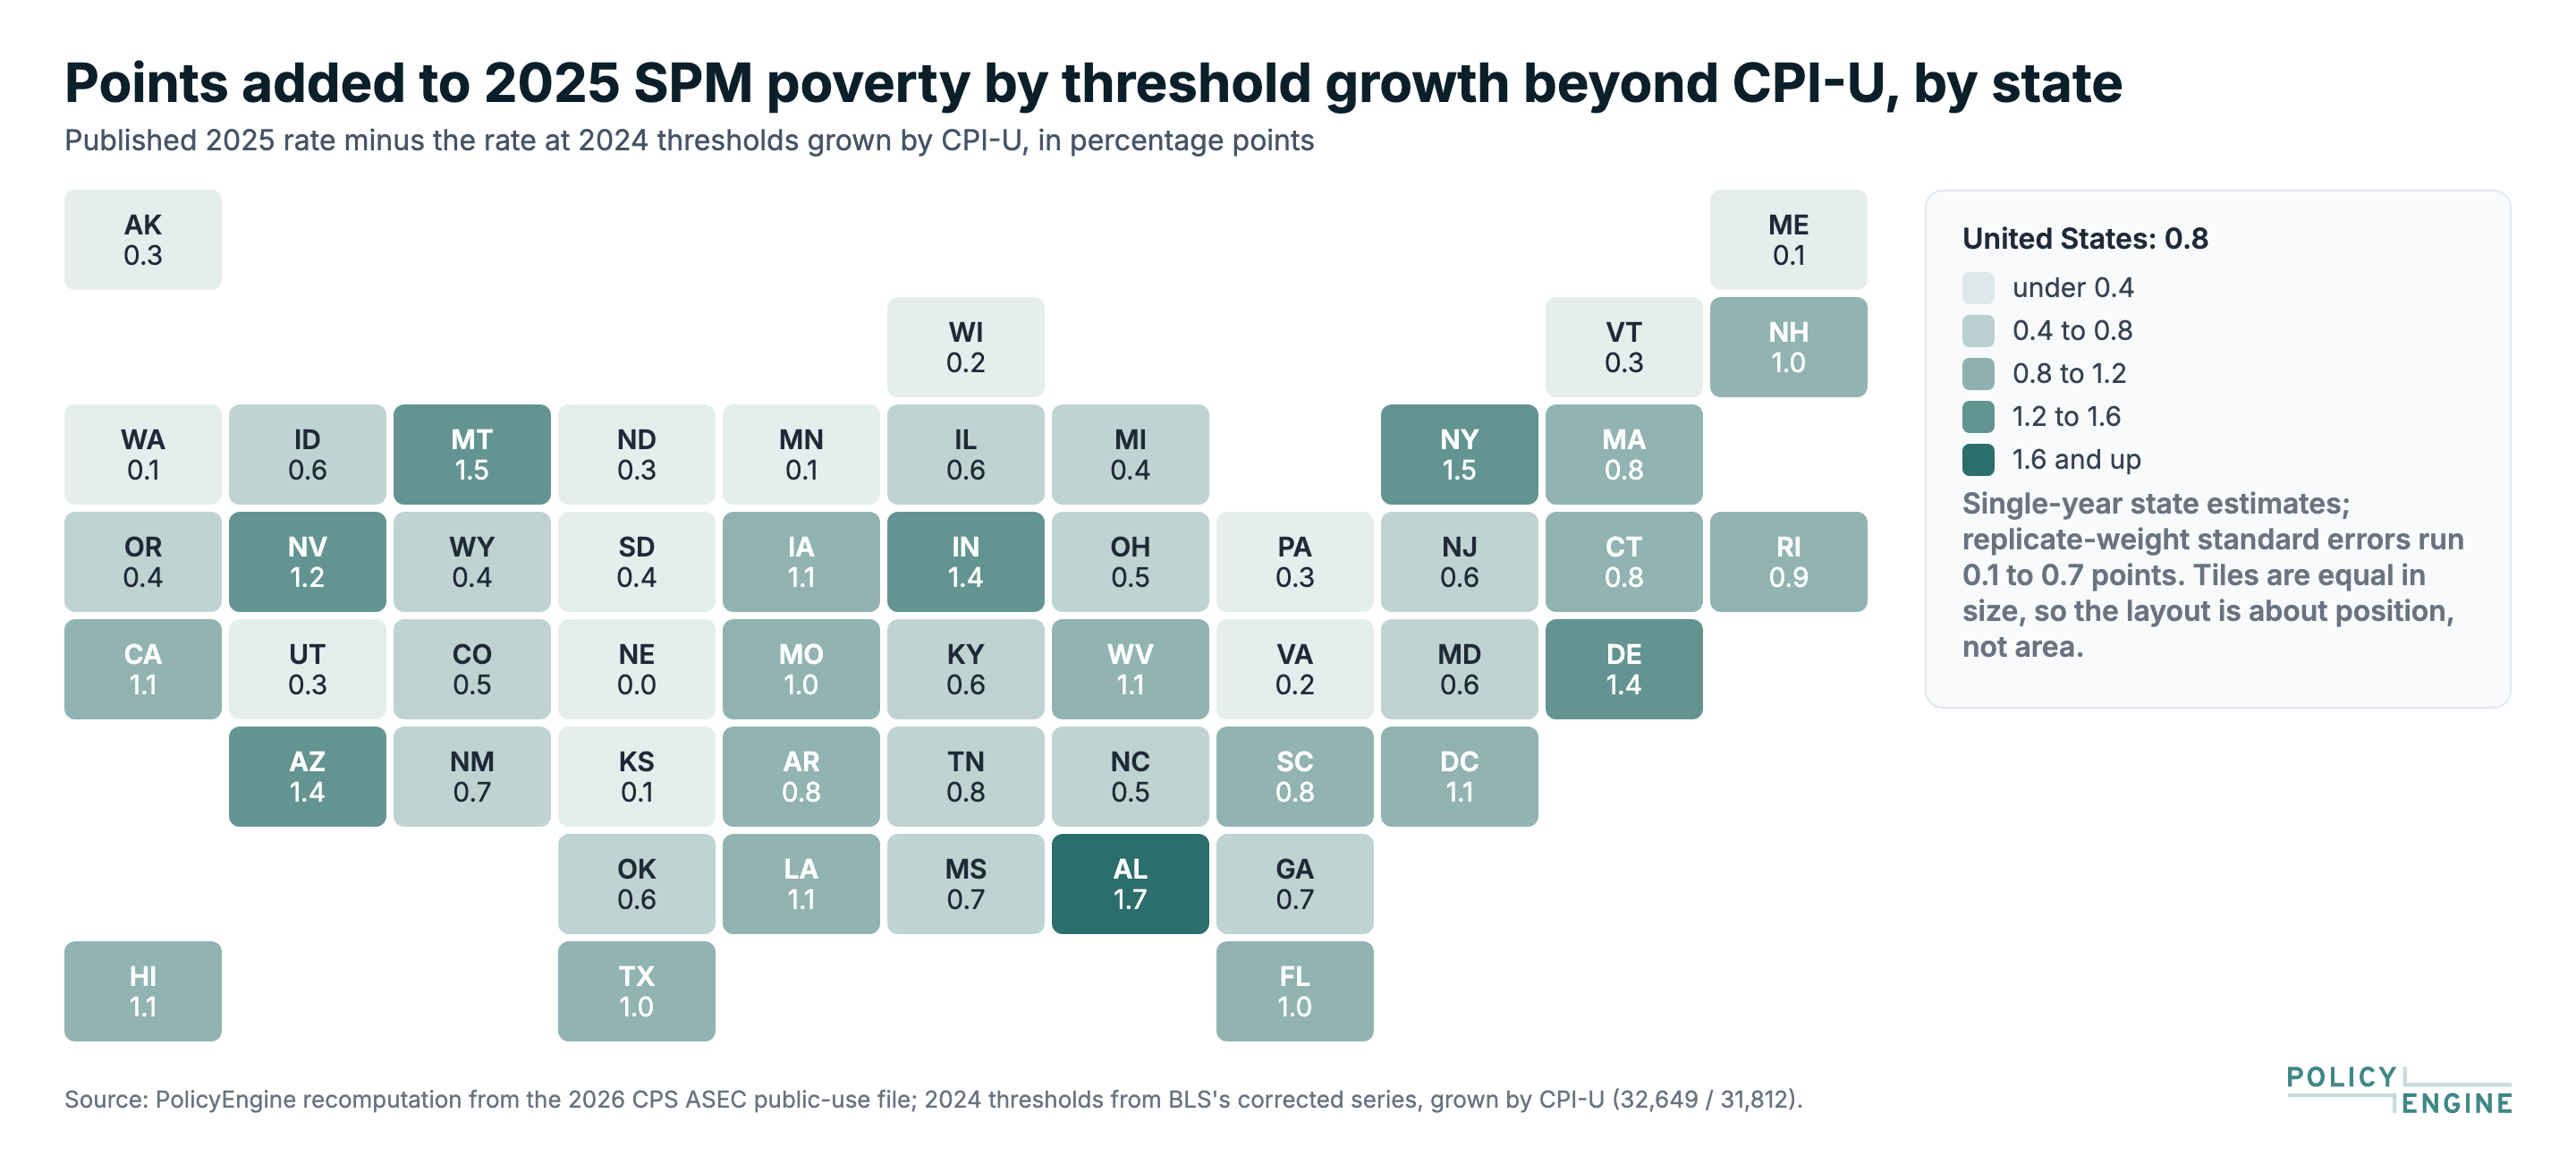 Points added to 2025 SPM poverty by threshold growth beyond CPI-U, by state
The published and anchored series answer different questions. BLS designs the SPM thresholds to move with what families near the middle spend on necessities, so the published series asks whether resources kept pace with that standard. The anchored series holds the standard fixed in real terms and asks whether resources kept pace with prices. In 2025 the two answers differ by 0.8 points, one year's threshold growth beyond inflation. The anchoring scales the national base only; the 2025 rent indices Census used for each area stay in place.
The SPM threshold calculator computes the 2025 threshold for any family and area and projects it forward; its methods paper documents how.
-
Table 11 of P60-290 prints the 2024 renter threshold as $37,231, which is BLS's corrected 2023 value; the corrected 2024 renter threshold is $39,220, the base for the 6.3 percent growth BLS reports for 2025. We use the BLS value, and the 2025 thresholds in the public-use microdata match BLS. We reported the discrepancy to Census. ↩
-
The 2025 column is our estimate for every row from the 2026 CPS ASEC public-use file, with standard errors from its 160 replicate weights; Census's published 2025 rates for the four groups it prints are 13.1, 13.4, 12.3 and 15.4. For 2024, Census publishes rates for all people, children, adults 18 to 64 and people 65 and over, restated on Vintage 2025 population controls; for those rows the ± figure converts the 90 percent margin of error in Table 4 to a standard error, dividing by 1.645. For the finer age groups, marked †, we computed 2024 from the 2025 file, which carries the earlier weights, the same way. On that file the four published groups come to 12.93, 13.35, 12.16 and 14.95 percent, 0.1 to 0.2 points below the restated figures, so the † changes sit on a slightly different basis from the others. ↩ ↩2
-
Each SPM unit in the public-use file carries its threshold, its resources, its housing tenure and the geographic adjustment Census applied. We scaled each unit's threshold by tenure so that the national two-adult, two-child base equals its 2024 value from the corrected BLS series (owners with a mortgage $39,231, owners without $32,879, renters $39,220) times the ratio Census used to move the official thresholds, 32,649 to 31,812, or 2.63 percent. Before anchoring, the same code reproduces the published rates: 13.11 percent for all people, 13.39 for children, 12.28 for people 18 to 64 and 15.38 for people 65 and over. Inputs are the 2026 file's person, household and replicate-weight tables (
pppub26.csv,hhpub26.csv,asec_csv_repwgt_2026.csv), BLS's 2025 thresholds and CPI-U. Code and outputs, including the per-state figures with standard errors, are in the spm-threshold-paper repository:replicate_and_anchor.py,state_age_anchored.py,state_tile_map.py,waterfall.pyand the JSON and CSV results they produce. ↩ ↩2 -
Its 2025 mean uses eleven months, because BLS had not published October 2025 when we ran it, and recent chained values are interim. ↩

PolicyEngine's Co-founder and CEO