
The SALT Caucus's Proposed Cap
We project that replacing the SALT cap approved by the Ways and Means Committee with the SALT Caucus proposal would cost $497 billion over the budget window.

Contents
Comparison of SALT Caps
Household Impacts
Microsimulation Results
Conclusion
Appendix A: Baseline Details
In our previous report, we simulated the SALT cap set in “The One, Big, Beautiful Bill,” which phases down a $30,000 cap to $10,000 for filers with income above $400,000. While the Ways and Means Committee approved the bill yesterday, The Hill reports that SALT Caucus members have pushed to raise the cap to $62,000 ($124,000 for married filers), adjusted for inflation, unlike the bill.
Utilizing our baseline of the tax reforms in the Ways and Means bill (see Appendix A), we analyze how the SALT Caucus’s proposal would affect American households and the U.S. economy.
Key results (static):
-
Increases the cost of the tax bill by $497 billion from 2026 to 2035
-
Raises net income for 3.7% of Americans in 2026
-
Lowers the Supplemental Poverty Measure by less than 0.001%
-
Increases the Gini index of income inequality by 0.2%
Use PolicyEngine to view the full results or calculate the effect on your household.
Comparison of SALT Caps#
Under current law, the state and local tax deduction is set to become uncapped starting in 2026 after being limited to $10,000 under the Tax Cuts and Jobs Act. Under the BBB, the SALT deduction would be capped at $30,000, and once adjusted gross income reaches $400,000, the limitation phases down at a 20% rate until reaching $10,000 (the maximum, floor, and phase-out threshold are all halved for married filing separately filers).1
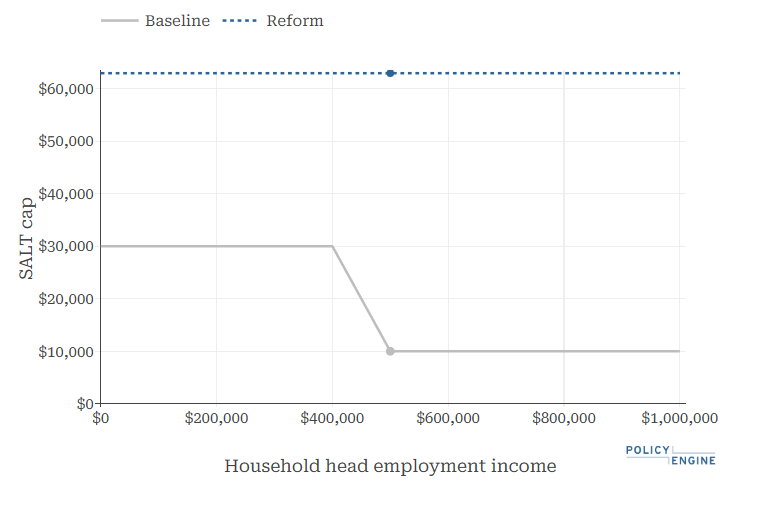
Under the SALT Caucus’s preferred limit, single filers could claim up to $62,000 in SALT, while the limit for married couples would be $124,000. Unlike the Ways and Means bill, the SALT Caucus’s cap would be implemented in 2025 rather than 2026, would not phase down for higher-income households, and the limits would be adjusted for inflation.2 Figure 1 displays the different SALT limits for single filers under both SALT caps.
Figure 1: W&M SALT Cap (Baseline) vs. SALT Caucus Proposal (Reform) (2026)
Household Impacts#
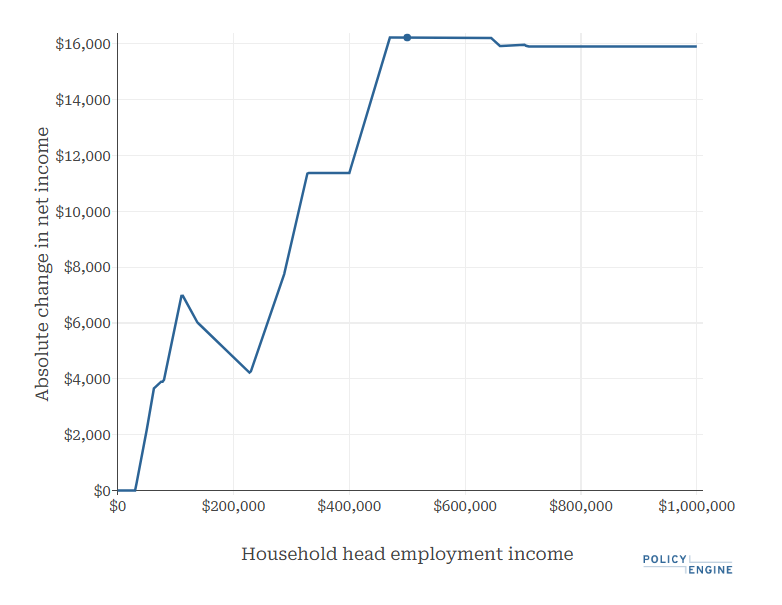
As we are only comparing between the BBB SALT cap and the one preferred by the SALT Caucus, only households that itemize their deductions and have state and local tax expenses greater than the Ways and Means limit would be affected. Let’s examine a similar household to the one we covered in the previous analysis: a single adult in New York making $500,000, but with $70,000 in property taxes (instead of $45,000). Under the BBB SALT cap, they would see a reduction in their net income of $28,391 in 2026, compared to if the SALT deduction became uncapped as it is scheduled to under current law. However, under the SALT Caucus proposal, their net income would fall by $12,012, representing a $16,379 gain when compared to the $30,000 SALT cap approved by the Ways and Means Committee. Figure 2 displays how the single adult’s net income would change as their household earnings vary if the approved SALT cap were replaced with the SALT Caucus proposal.
Figure 2: Effect of Replacing the SALT Cap on Net Income Based on Household Earnings for a Single Filer with $62,948+ in SALT (2026)
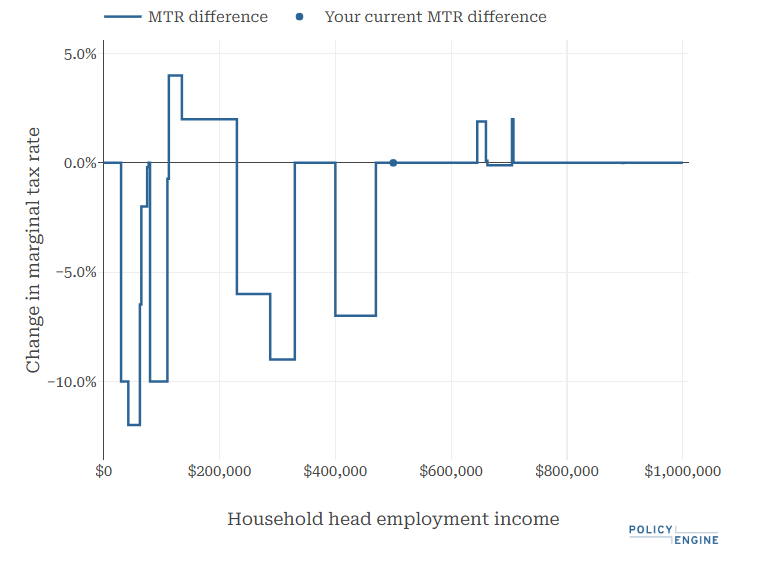
Replacing the cap would affect the single adult’s marginal tax rates (MTRs) at various earnings levels, as shown in Figure 3. Because the SALT Caucus cap does not include a phase-out, the filer’s MTR is reduced by 7 percentage points between $400,000 and $470,000.
Figure 3: Change in Marginal Tax Rates Based on Household Earnings for a Single Filer with $62,948+ in SALT (2026)
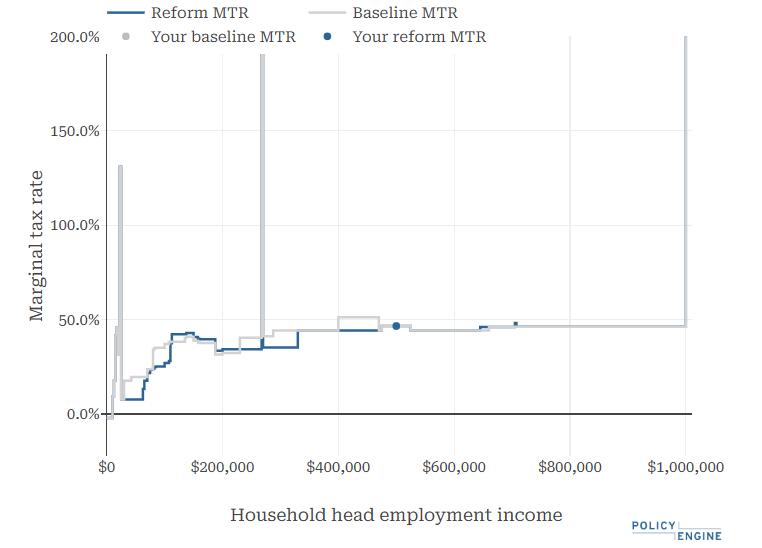
Due to the removal of the SALT cap phase-out, the total marginal tax rate falls from 51.2% to 44.2% for earnings between $400,000 to $470,000.
Figure 4: Marginal Tax Rates under the Baseline and with the SALT Caucus Proposal Based on Household Earnings for a Single Filer with $62,948+ in SALT (2026)
Microsimulation Results#
Using PolicyEngine’s static microsimulation model, we project that replacing the $30,000 SALT cap with the SALT Caucus proposal would increase the cost of the tax package by $496.8 billion over the next ten years (2026–2035).3 Additionally, because the SALT Caucus proposal goes into effect in 2025, it would lower federal revenues by $43.3 billion that year since it raises the current $10,000 cap.
Table 1: Annual Federal Revenue Impact of Replacing the BBB SALT Cap with the SALT Caucus Proposal
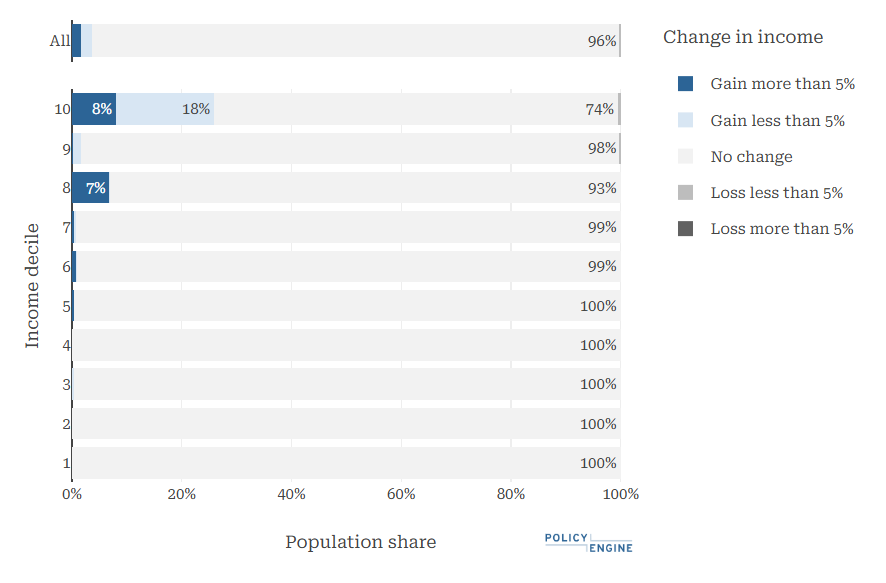
The SALT cap would increase the net income of 3.7% of US residents in 2026, including 26% of residents in the top decile and 1.2% of those in the bottom nine deciles.
Figure 6: Winners of the Replacing the SALT Cap Under the W&M Bill (2026)
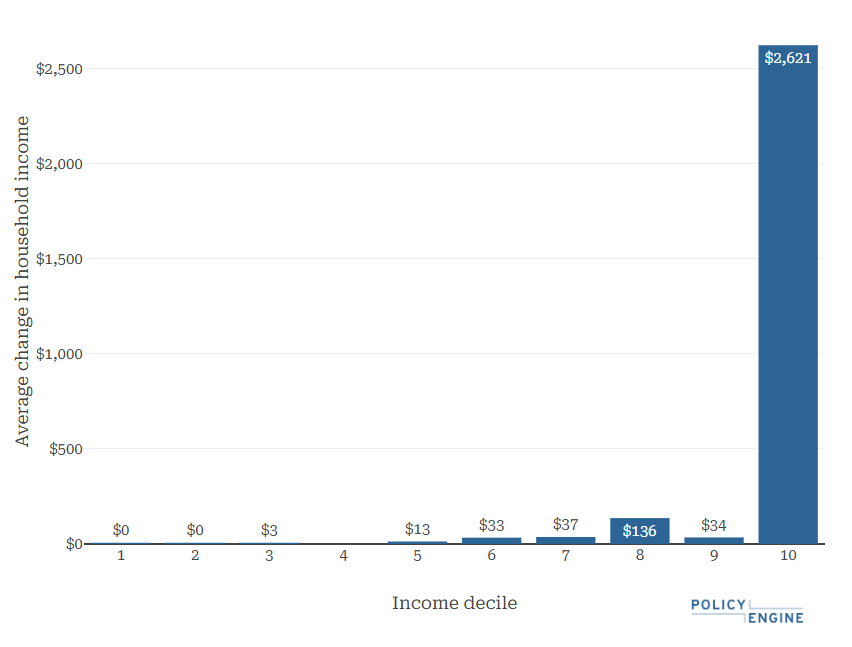
Households in the top decile see their tax liability fall by $2,621 on average. The bottom four deciles would see an average gain of $3 or less.
Figure 6: Average Impact of the SALT Cap Under the W&M Bill (2026)
When it comes to poverty and inequality, the SALT Caucus proposal would, in 2026:
-
Lower poverty (as defined by the Supplemental Poverty Measure) by 0.00006%,
-
Reduce deep poverty by 0.0002%,
-
Raise the Gini index of inequality by 0.2%, and the top 1%’s share of net income by 3.0%
Conclusion#
Conditional on other provisions in the BBB, we find that implementing the SALT Caucus’s preferred limits of $62,000 and $124,000, compared to the $30,000 cap approved by the committee, would increase the cost of the bill by $497 billion over ten years, assuming no behavioral responses. The new limitation would increase the after-tax incomes of 3.7% of the population in 2026, with households in the top income decile experiencing the largest gains on an absolute and relative basis. The SALT Caucus cap is projected to reduce poverty by less than 0.001%, while raising the Gini index by 0.2%.
As policymakers evaluate reforms such as these, analytical tools like PolicyEngine offer critical insights into the impacts on diverse household compositions and the broader economy.
We invite you to explore our additional analyses and use PolicyEngine to calculate your own tax benefits or design custom policy reforms.
Appendix A: Baseline Details#
Our baseline includes most individual provisions in the Ways and Means bill, as shown in Table 2.
Table 2: Individual Tax Provisions Current Law vs. W&M Bill
*Indexed for Inflation
-
The Ways and Means bill also includes provisions that are meant to limit workarounds that states have implemented to avoid the SALT cap. We did not model these provisions in this analysis. ↩
-
As there is no reported details regarding the inflation adjustments, we rounded to the nearest dollar for all thresholds following tax year 2025. In 2026, the SALT Caucus caps would be uprated to $62,948 for single filers and $125,896 for married couples. ↩
-
We project that state tax revenues would decrease by $2.9 billion over the budget window (2026-2035). ↩
-
The Ways and Means tax bill adjusts the year at which the 35% tax bracket is uprated changing it from 2017 to 2016, thereby raising the bracket threshold higher than previously. ↩
-
In 2029, the maximum value of the CTC would drop as the temporary $500 boost expires. However, since the CTC is adjusted for inflation afterwards using 2024 as the base year, the credit’s value would fall to $2,200 rather than $2,000. Additionally, we do not include the SSN changes to the CTC in this analysis, but plan to include the provision in future reports. ↩

Research Analyst at PolicyEngine