
Introducing the OBBBA Household Explorer
New interactive tool reveals household-level impacts of the One Big Beautiful Bill Act.

Contents
What the tool does
Examples
Couple in Montana, Senate bill against current law
Couple in Georgia, House bill against current policy
Key features
🎲 Quick exploration
📊 Comprehensive analysis
🔍 Detailed filtering
📈 Provision-by-provision breakdown
Multiple baselines and versions
Representative data you can trust
Get started
Following the Senate's July 1st passage of the One Big Beautiful Bill Act (OBBBA), we're launching the OBBBA Household Explorer — an interactive dashboard that shows how this reconciliation bill would affect individual households across America.
Explore Households with our new tool here.
What the tool does#
The OBBBA Household Explorer allows users to explore the bill’s impacts on over 40,000 representative households from PolicyEngine’s Enhanced Current Population Survey (CPS) dataset. This dataset integrates and calibrates multiple data sources using machine learning techniques — the same foundation that powers PolicyEngine’s simulations of policy effects on poverty, inequality, and government budgets, when paired with our comprehensive model of federal, state, and local income tax and benefit programs.
The OBBBA extends provisions of the 2017 Tax Cuts and Jobs Act set to expire at the end of 2025, while introducing new elements including:
-
Tax exemptions for tip and overtime income
-
Modifications to the Child Tax Credit
-
Changes to the SALT deduction cap
-
Cuts to SNAP, Medicaid, and Affordable Care Act Premium Tax Credits
By capturing these and more as of 2026, we show the breadth of the bills’ impacts on households that collectively represent the nation.
Examples#
To illustrate the tool’s capabilities, let’s explore two households. While both are couples around 60 years old, varying attributes and analysis configurations shows how results vary.
Couple in Montana, Senate bill against current law#
First consider household #66994, a couple in Montana, ages 53 and 61, with $214,850 income.
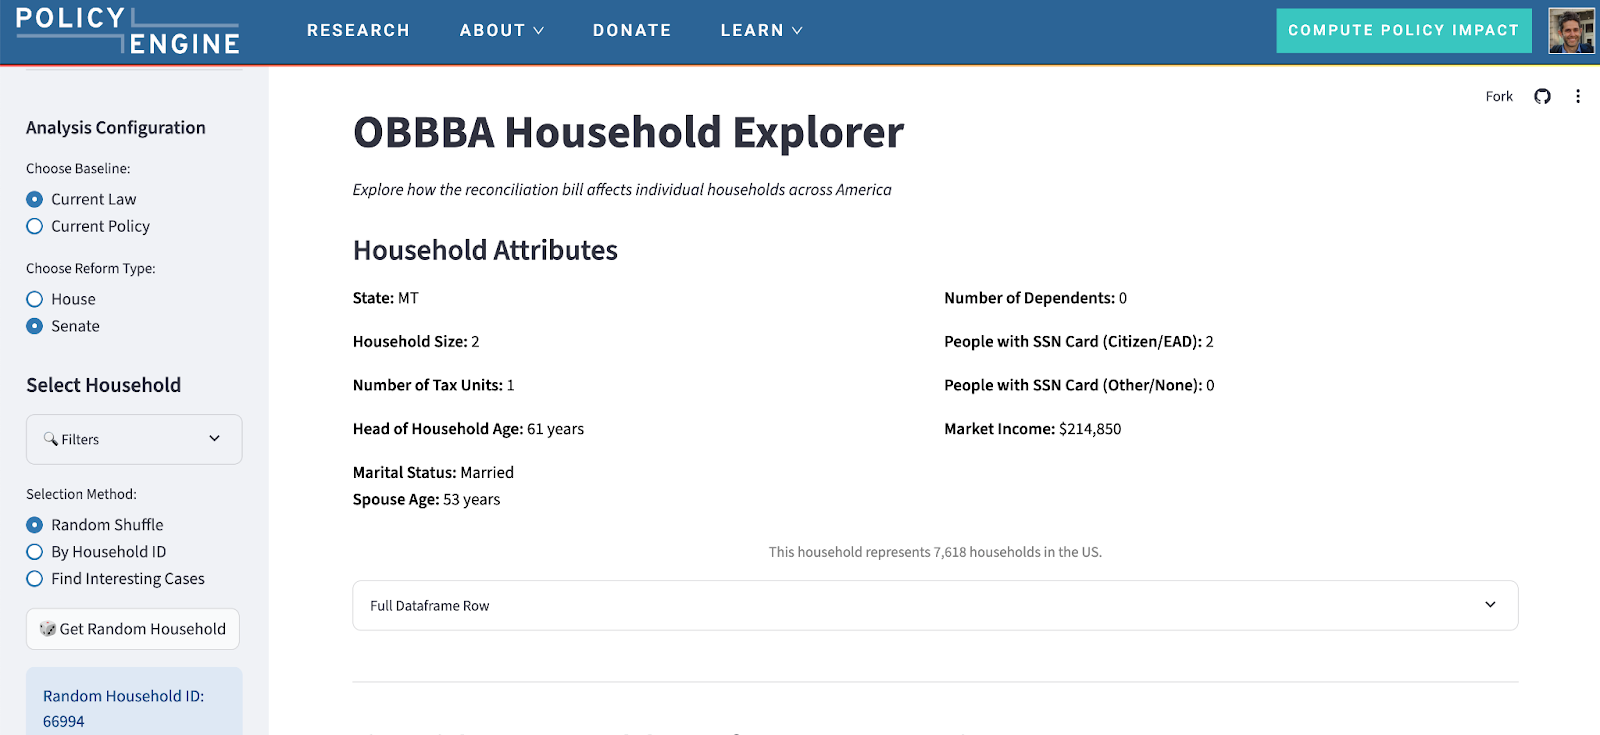
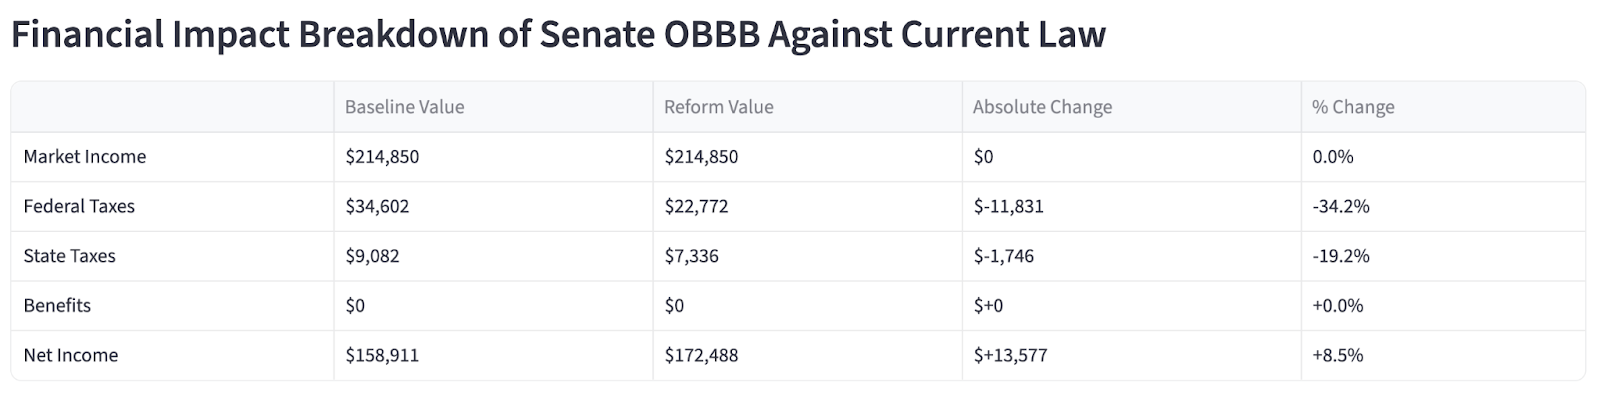
Comparing the Senate bill to current law, they would gain $13,577, paying $11,831 less in federal tax and $1,746 less in state tax.
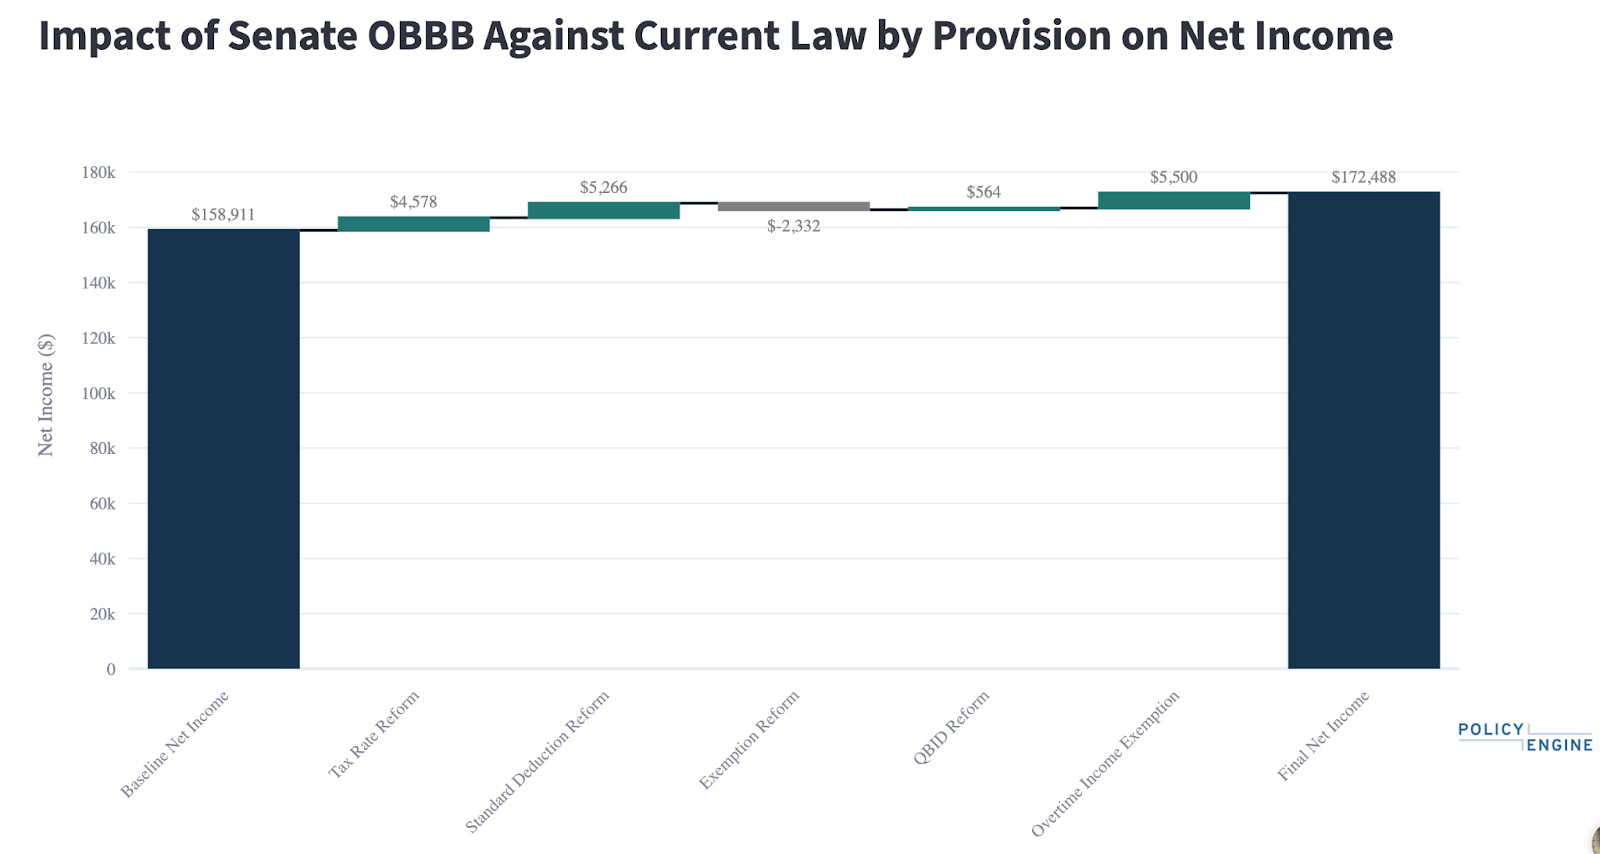
That $13,577 gain results from reforms to the tax brackets, standard deduction, qualified business income deduction, and overtime income exemption, less a $2,332 loss from the repeal of exemptions.
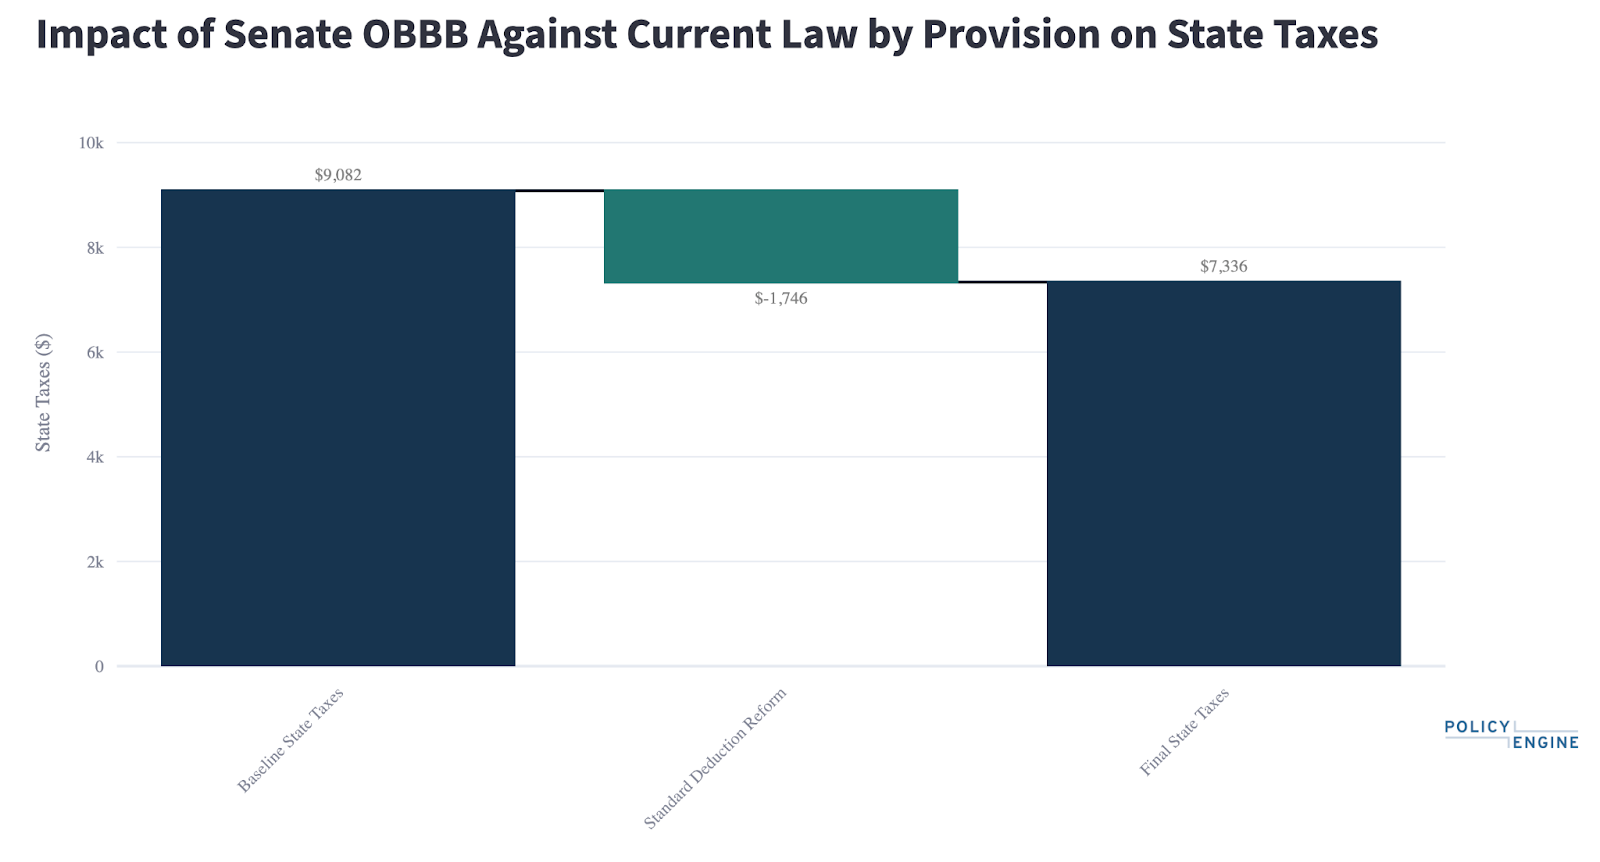
We can also select state taxes to explore the $1,746 gain, finding that it results from the standard deduction reform. Beginning in 2024, Montana adopted the federal standard deduction by statute. PolicyEngine's TAXSIM-validated tax model captures these interactions between federal and state policy.
Couple in Georgia, House bill against current policy#
Next let's consider household #43826, a Georgia couple with $71,820 income.
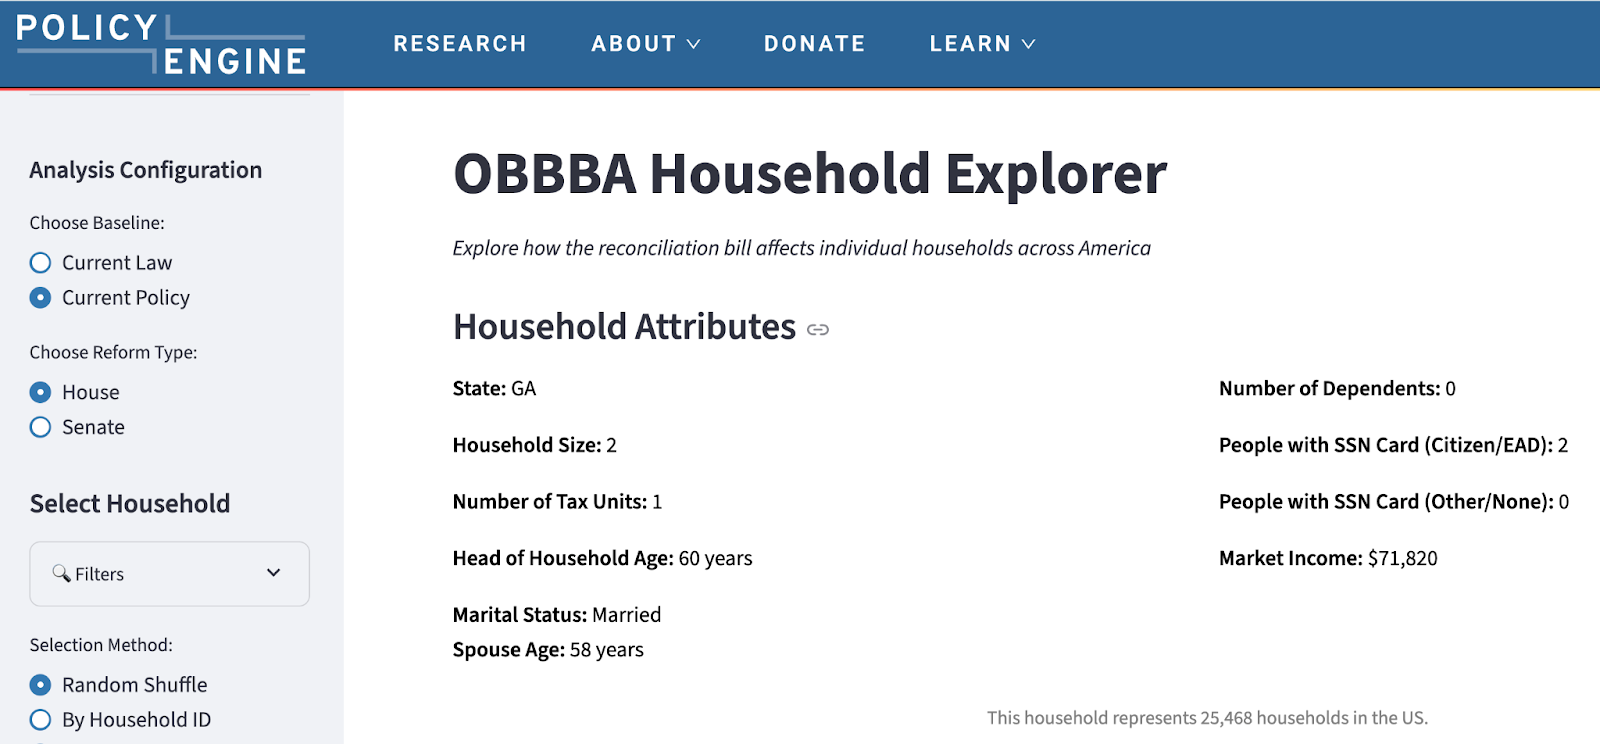
This household would pay $1,023 less in federal tax, while losing $1,971 in benefits, for a net loss of $947.
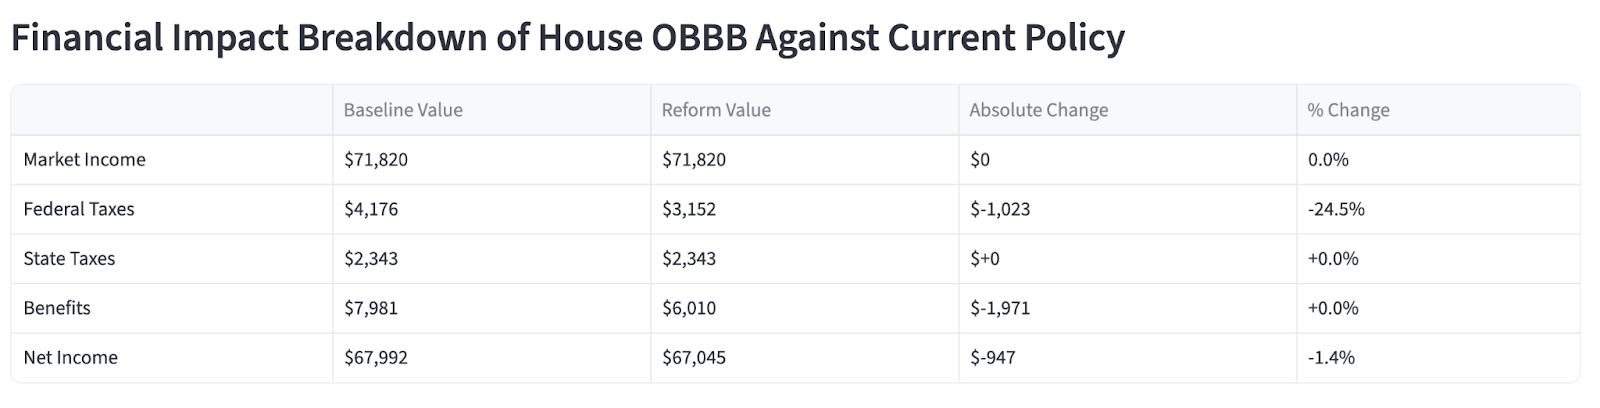
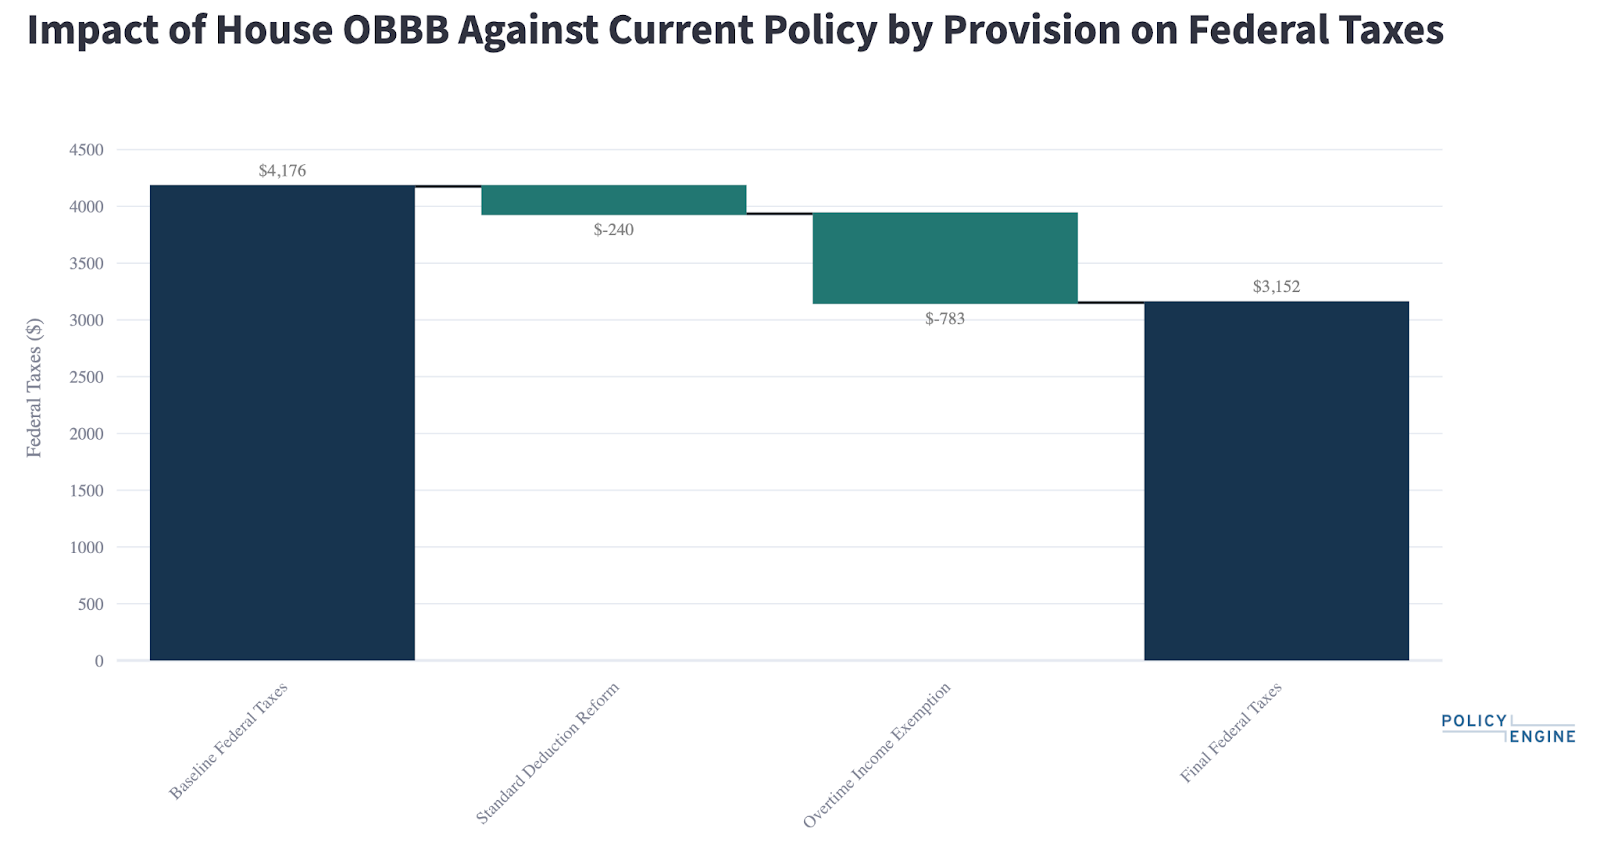
Like the Montana couple, this couple benefits from the standard deduction reform and overtime exemption.
However, they lose $1,971 in Affordable Care Act Premium Tax Credits, whose enhancements (which are part of current policy) expire at the end of 2025.
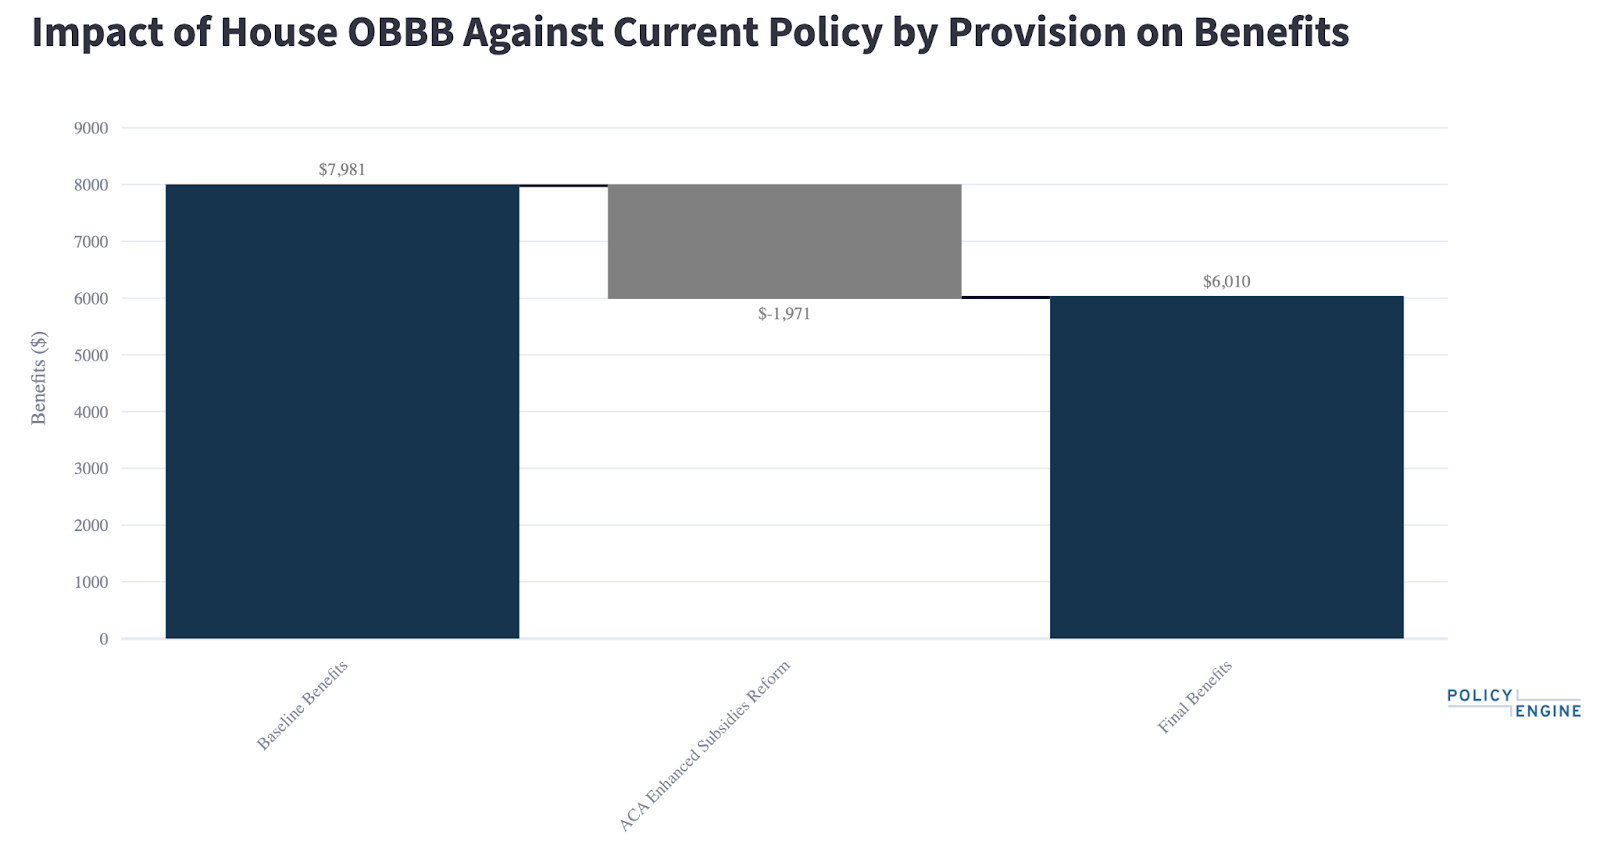
PolicyEngine counts premium tax credits as benefits since they are subsidized premiums throughout the year. Our rules engine calculates these credits to the dollar. Additionally, our rules engine calculates the dollar impacts of households modeled to lose SNAP and Medicaid access, per projections from the Congressional Budget Office.
Key features#
To go beyond these examples (and household #118944 for this report’s cover image), you can leverage the tool’s full set of features.
🎲 Quick exploration#
The Get Random Household button lets you instantly explore impacts across America’s diverse population. Each click reveals a different household, weighted by population representation — allowing rapid exploration of how impacts vary by circumstance.
📊 Comprehensive analysis#
The tool analyzes impacts on:
-
Federal taxes: Changes from tax rate adjustments, deductions, and credits
-
State taxes: How federal changes affect state income tax liability
-
Benefits: Changes to programs like SNAP, Medicaid, and ACA subsidies
-
Net income: Combined effect on take-home pay
🔍 Detailed filtering#
Find households similar to your situation by:
-
State
-
Income level
-
Marital status
-
Number of dependents
-
Age of household head
-
Household weight (population representation)
📈 Provision-by-provision breakdown#
Interactive waterfall charts show exactly how each reform component contributes to the total impact:
-
Tax rate changes
-
Standard deduction modifications
-
Child Tax Credit changes
-
SALT cap adjustments
-
AMT reforms
-
Tip and overtime exemptions
-
Over a dozen other provisions
Multiple baselines and versions#
Users can compare impacts against:
-
Current law baseline: What happens if TCJA provisions expire
-
Current policy baseline: What happens if TCJA provisions are extended
And analyze both:
-
House version: Passed May 22, 2025
-
Senate version: Passed July 1, 2025
Representative data you can trust#
The tool uses PolicyEngine’s Enhanced CPS dataset, which represents the full diversity of American households. This allows exploration of impacts across different:
-
Geographic regions
-
Income levels
-
Family structures
-
Employment situations
-
Benefit receipt patterns
Whether examining a restaurant worker benefiting from tip exemptions, a family affected by Child Tax Credit changes, or a household navigating SALT cap modifications, the tool provides detailed impact analysis.
Get started#
The OBBBA Household Explorer is available now at policyengine.org/us/obbba-household-explorer.
Start exploring by:
-
Using the Get Random Household button to quickly survey diverse impacts
-
Applying filters to find households similar to yours
-
Selecting specific household IDs for detailed analysis
-
Finding “interesting cases” — households with the largest positive or negative impacts
As Congress continues to debate the final form of this legislation, the OBBBA Household Explorer provides a window into how these policy changes would affect real American households.

PolicyEngine's Co-founder and CEO

Economist at PolicyEngine

Data Science Intern at PolicyEngine