
Analysis of individual income tax provisions in the final reconciliation bill
Our simulation projects a reduction in federal revenues of $3.8 trillion from 2026 to 2035 compared to current law.

Contents
Income Tax Provisions
Household impacts
Elderly couple in Texas
Single undocumented parent in New York
Single adult in Montana with tip income
High-income couple with two children in California
Microsimulation Results
Budgetary impact
Distributional impact
Conclusion
Appendix 1: Summary of Provisions
Yesterday, the House of Representatives passed H.R. 1, also known as the “One Big Beautiful Bill Act” (OBBB), after the Senate amended and approved it on July 1st. The reconciliation package now heads to President Donald Trump’s desk who is expected to sign the legislation into law. H.R. 1 extends and expands several provisions of the Tax Cuts and Jobs Act of 2017 (TCJA), while adding new individual income tax provisions such as deductions for tips and overtime.
Applying the PolicyEngine microsimulation model to most of these provisions, we find that the bill’s individual income tax provisions — compared to current law in which Tax Cuts and Jobs Act provisions expire after 2025 — would:
-
Reduce federal revenues by $3.8 trillion between 2026 and 2035
-
Benefit 76% of Americans, while reducing net income for 8% of the population in 2026
-
Reduce poverty and deep poverty by 5.5% and 6.1%, respectively in 2026
-
Increase the Gini index of inequality by 0.4% in 2026
This report details these results and shows the effects on hypothetical households.
Income Tax Provisions#
While similar to the tax provisions passed by the House of Representatives in May, the final version of the OBBB contains some key differences. In general, the latest bill text makes permanent more tax provisions compared to the bill in May, which implemented temporary boosts throughout the current presidential term. For example, in the bill text from May, the CTC is temporarily boosted to $2,500 before falling to a lower value in 2029. In the latest text, the Child Tax Credit (CTC) is increased to $2,200 and then indexed for inflation thereafter. This shift from temporarily enhancing provisions to permanent increases is also found in the standard deduction provision.
The approved bill also places explicit limits on the tips and overtime income exemptions. In the May draft, both provisions were only accessible to those with less than $160,000 of adjusted gross income. In the final bill text, tips are limited to $25,000 per filer, and the overtime exemption has a cap of $12,500 for single filers and $25,000 for married couples. Each limit then phases down at a 10% rate beginning at $150,000 and $300,000 for single and joint filers, respectively.
The bill versions also treat the state and local tax (SALT) deduction differently. Following a compromise between the House SALT Caucus and Republican leadership, the SALT deduction is set to $40,000 and phased down to $10,000 once adjusted gross income reaches $500,000. This structure was permanent in the May bill text, and each parameter would grow by 1 percent over the budget window in perpetuity. In the final bill, this structure is preserved until 2030, when the SALT cap drops to its current policy value of $10,000.
Compared to the House bill, the final bill also:
-
Freezes the first two income tax bracket thresholds from 2025 onwards.
-
Requires only one parent to have a valid SSN to claim the CTC (rather than both in the May bill text).
-
Resets only the inflation adjustment for the phaseout threshold of the alternative minimum tax (AMT) and increases the phase-out rate to 50%.
-
Limits all itemized deductions at the 35% bracket, rather than having a separate limitation at the 32% bracket for the SALT deduction.
-
Sets a qualified business income deduction rate of 20% and creates a minimum deduction of $400 for taxpayers with qualified business income of at least $1,000.
-
Increases the senior deduction amount to $6,000 and the phaseout rate to 6%.
-
Increases the charitable deduction for non-itemizers to $1,000 and $2,000 for joint filers, while also making the provision permanent.
-
Increases the maximum match of the Child and Dependent Care Tax Credit and implements a two-tier phase-down structure.
-
Excludes 0.5% of a filer’s adjusted gross income from their deductible charitable contributions.
Each of these discussed provisions and all differences between the versions, for all provisions we model, are summarized in Appendix 1. Let’s examine a few household examples to understand the tax provisions’ effect on specific tax units.
Household impacts#
In 2026, when most provisions are active, households would experience a change in net income dependent on their composition and income sources.
Elderly couple in Texas#
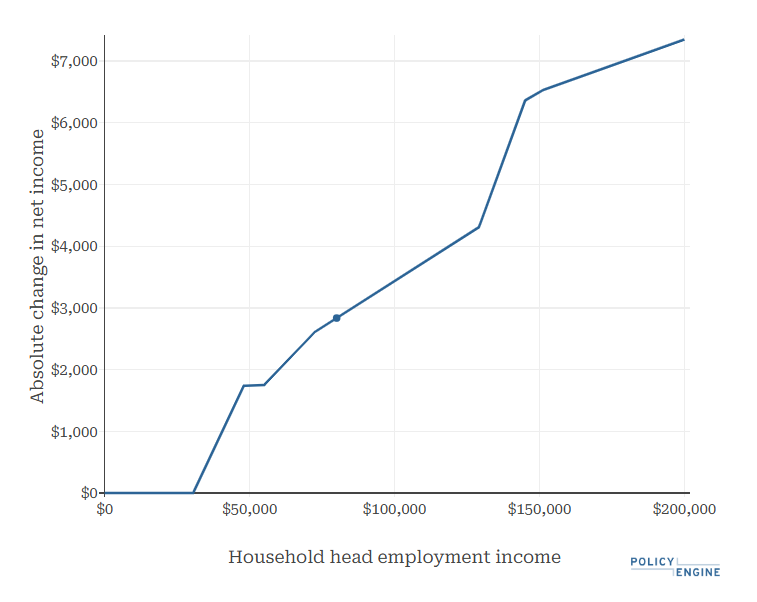
An elderly couple with $80,000 in employment income from Texas would see their net income rise by $2,835. While they would benefit from the TCJA extension compared to current law, this couple would also qualify for the additional senior deduction of $12,000 ($6,000 for each elderly member). This paired with the existing additional deduction for senior couples ($3,200) and the extension of the TCJA standard deduction ($32,600 in 2026) prevents this couple from paying any income tax on their first $47,800 of earnings compared to $30,400 under current law.
Figure 1 shows this household’s change in net income over household earnings. Once earnings exceed $30,400, the household begins to see an increase in their net income before plateauing at $47,800. When annual income surpasses $54,500, net income begins to rise again.
Figure 1: Change in Net Income for an Elderly Couple Between $0 and $200,000 of Earnings (2026)
Single undocumented parent in New York#
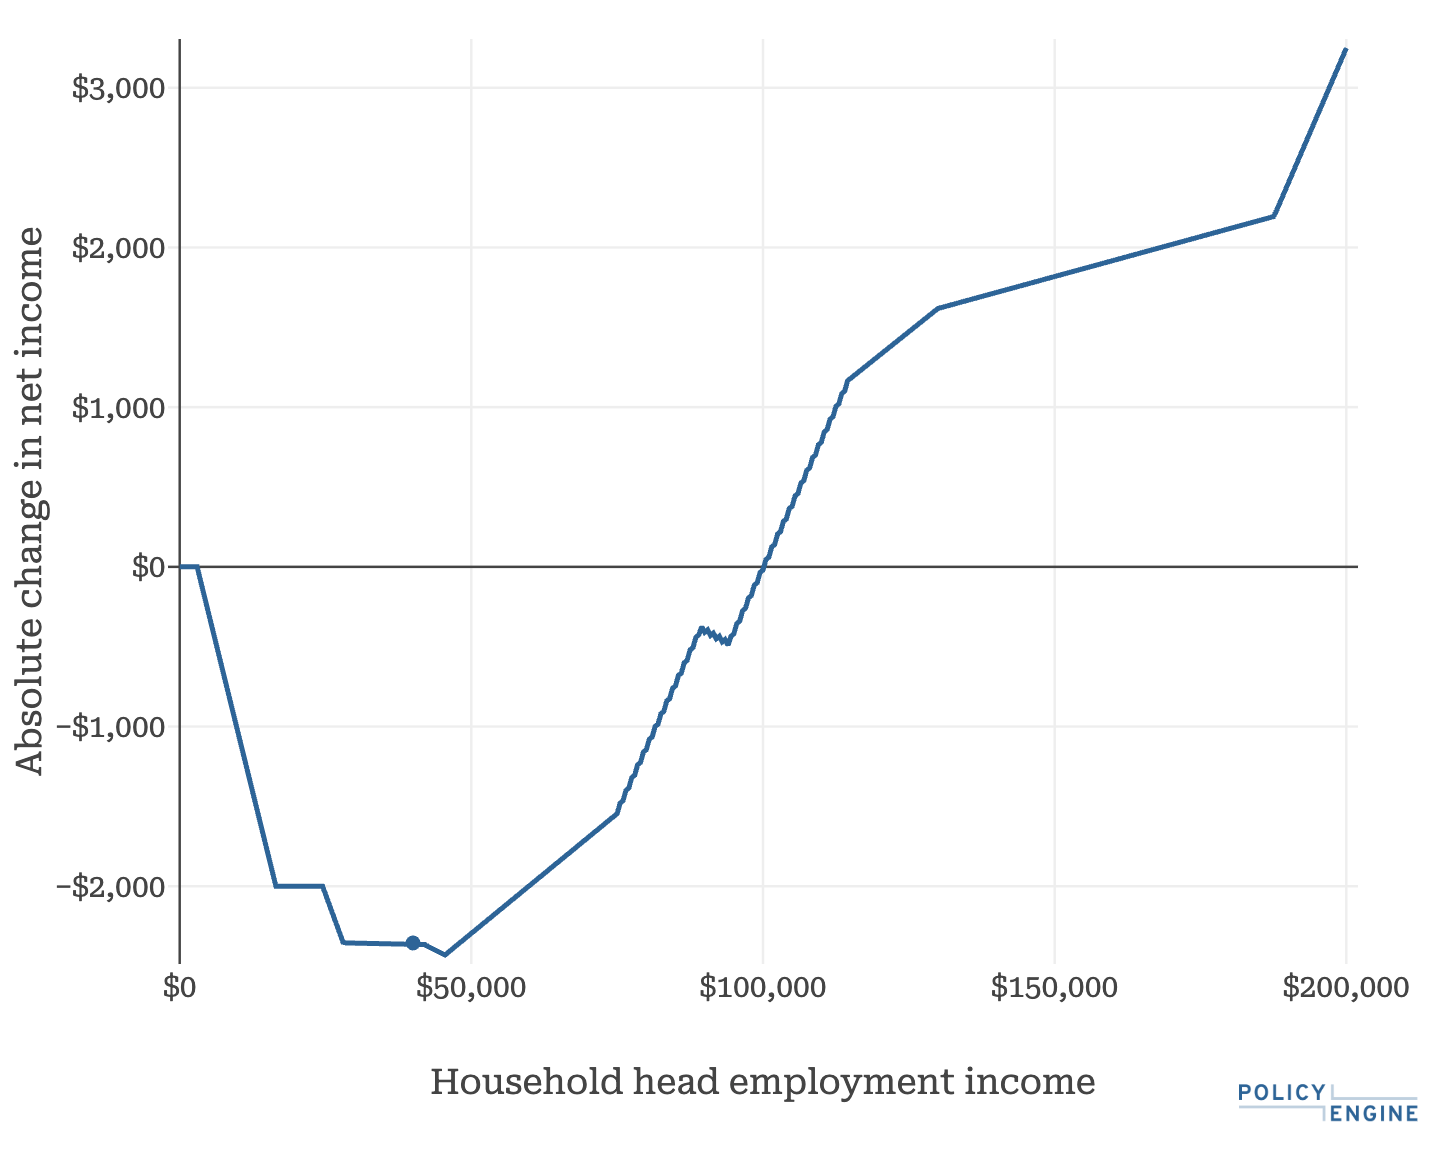
A single parent in New York with two children and $40,000 of earnings would be in line to benefit from the increased CTC compared to current law. However, due to the new SSN requirement for parents under the Senate bill, if they did not have a valid SSN, their net income would fall by $2,335 as they would become ineligible for the CTC valued at $1,000 per child under current law. The additional loss of $335 stems from their combined personal exemptions and standard deduction under current law exceeding OBBB’s standard deduction by $3,550. As this makes them face the 10% income bracket, their tax liability increases by $355.
Figure 2 shows that their net income falls at any earnings level between $3,000 and $100,000, and the maximum loss occurs at $45,500 earnings.
Figure 2: Change in Net Income for an Undocumented Single Parent in New York Between $0 and $200,000 Earnings (2026)
Single adult in Montana with tip income#
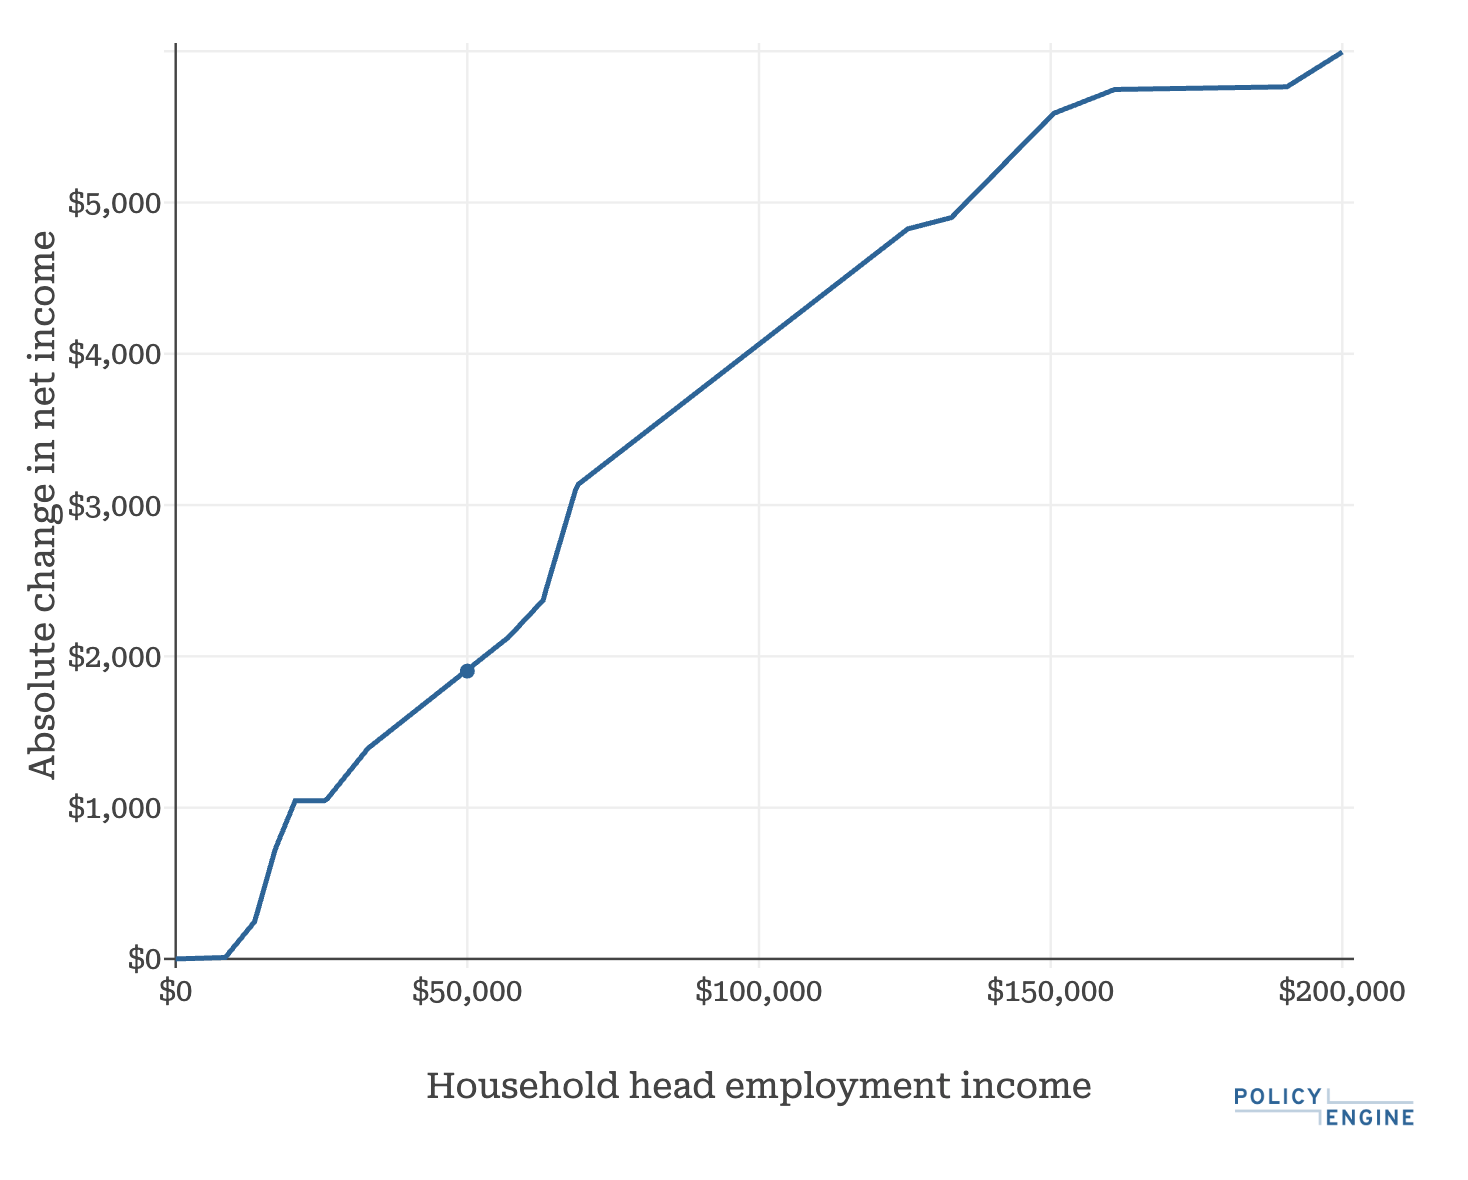
A single adult from Montana with $50,000 of salaries including $4,000 from tips would gain $1,903 from the Senate tax provisions. As the filer’s income falls below the tip income exemption cap, they can fully deduct their $4,000 of tipped income from their federal tax return. In addition to also benefitting from the TCJA extensions, Montana ties its standard deduction to the federal amount by statute, resulting in a lower state tax liability of $731 (included in the total benefit).
Figure 3 shows that the filer’s benefit increases with earnings, for earnings above $8,000.
Figure 3: Change in Net Income for a Single Adult in Montana with Tip Income, Between $0 and $200,000 Earnings (2026)
High-income couple with two children in California#
For a joint filer with two children in California with $1 million of annual income and $60,000 of itemized deductions across several sources, household net income would drop by $9,627 compared to current law. While this filer would benefit from the extensions of the reduced income tax rates, floor exclusion of charitable contributions, and the $40,000 SALT cap all reduce the tax savings the household would be eligible under current law.
In Figure 4, the filer from California benefits from the OBBB seeing its highest increase in net income near $505,000 of earnings. However, at higher earnings levels, the bill limits their itemized deductions, resulting in increasing net losses at earnings levels above $885,000 (including those beyond the $2 million viewable area in Figure 4).
Figure 4: Change in Net Income for a Married Couple of Two Children and Several Itemized Deductions Between $0 and $2 Million of Earnings (2026)
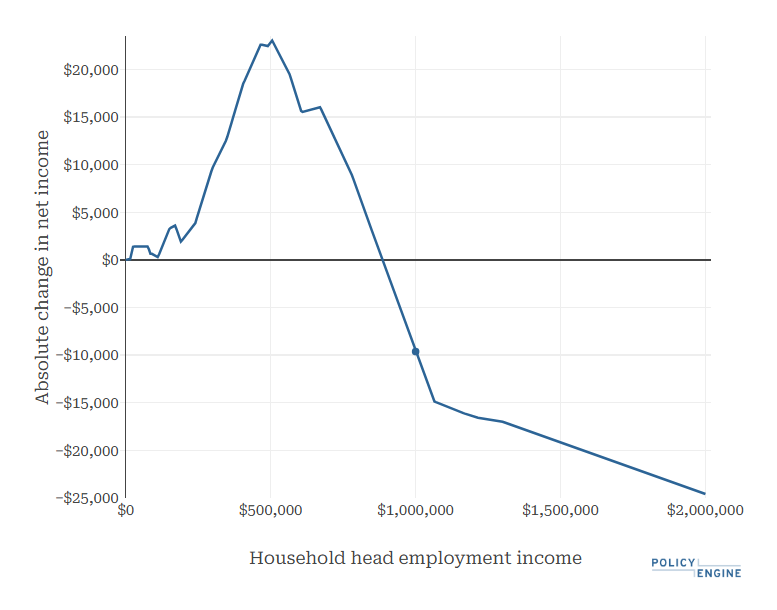
Table 1 below summarizes each filer’s characteristics and their change in net income for tax year 2026.
Table 1: Change in Net Income Based on Household Composition
Microsimulation Results#
Budgetary impact#
Using PolicyEngine’s static microsimulation model, we project that the Senate tax provisions of the One Big Beautiful Big Act would cost $3.8 trillion from 2026 to 2035. Additionally, because several proposed changes go into effect this tax year, it would reduce federal revenues by $63.8 billion in 2025.
Table 2: Annual Federal Revenue Impact of the Income Tax Provisions in the OBBB.
Distributional impact#
Our distributional analysis includes the OBBB’s effect on federal taxes, as well as state and local taxes resulting from statutory references to the federal code (e.g., Montana applying the federal standard deduction).
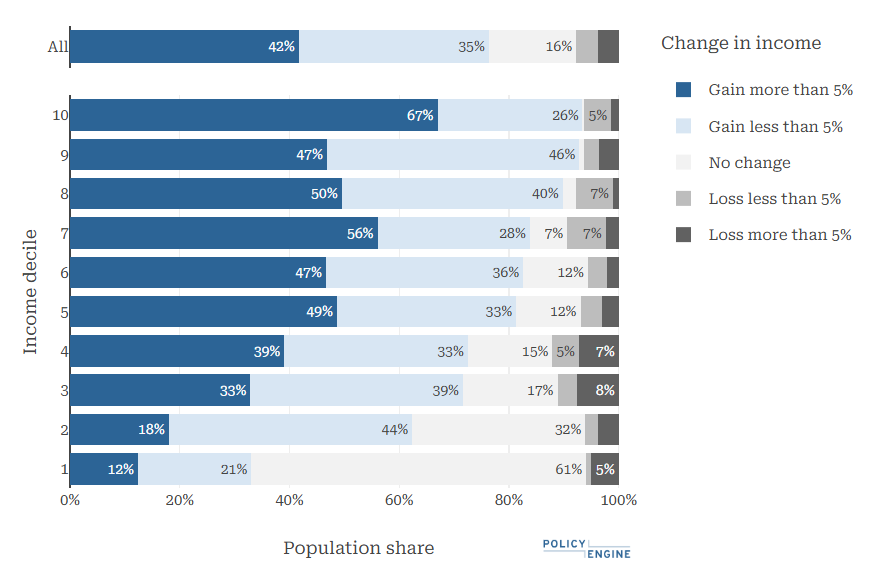
The bill would increase the net income of 76% of U.S. residents in 2026. The percentage of U.S. residents would vary by income decile, as the highest income decile would have the highest percentage of residents benefiting at 93.5%, while the lowest would have 33.1% of residents see an increase in their net income. Additionally, 7.7% of the U.S. population would be worse off under the tax provisions in 2026. The reduction of net income for residents can be attributed to the SSN requirements for parents to claim the CTC (mostly affecting lower to middle-income households) and limitations on itemized deductions (mostly affecting higher-income tax units).
Figure 5: Winners and Losers of the Income Tax Provisions in the OBBB (2026)
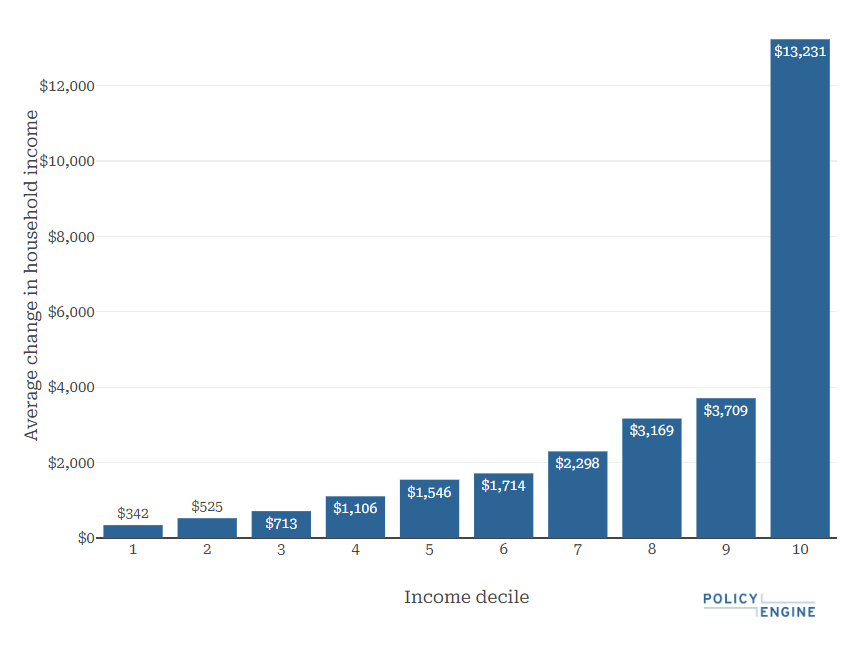
In 2026, households in the bottom deciles would gain an average of $342, while those in the top decile would gain an average of $13,231.
Figure 6: Average Household Impact of the Income Tax Provisions in the OBBB (2026)
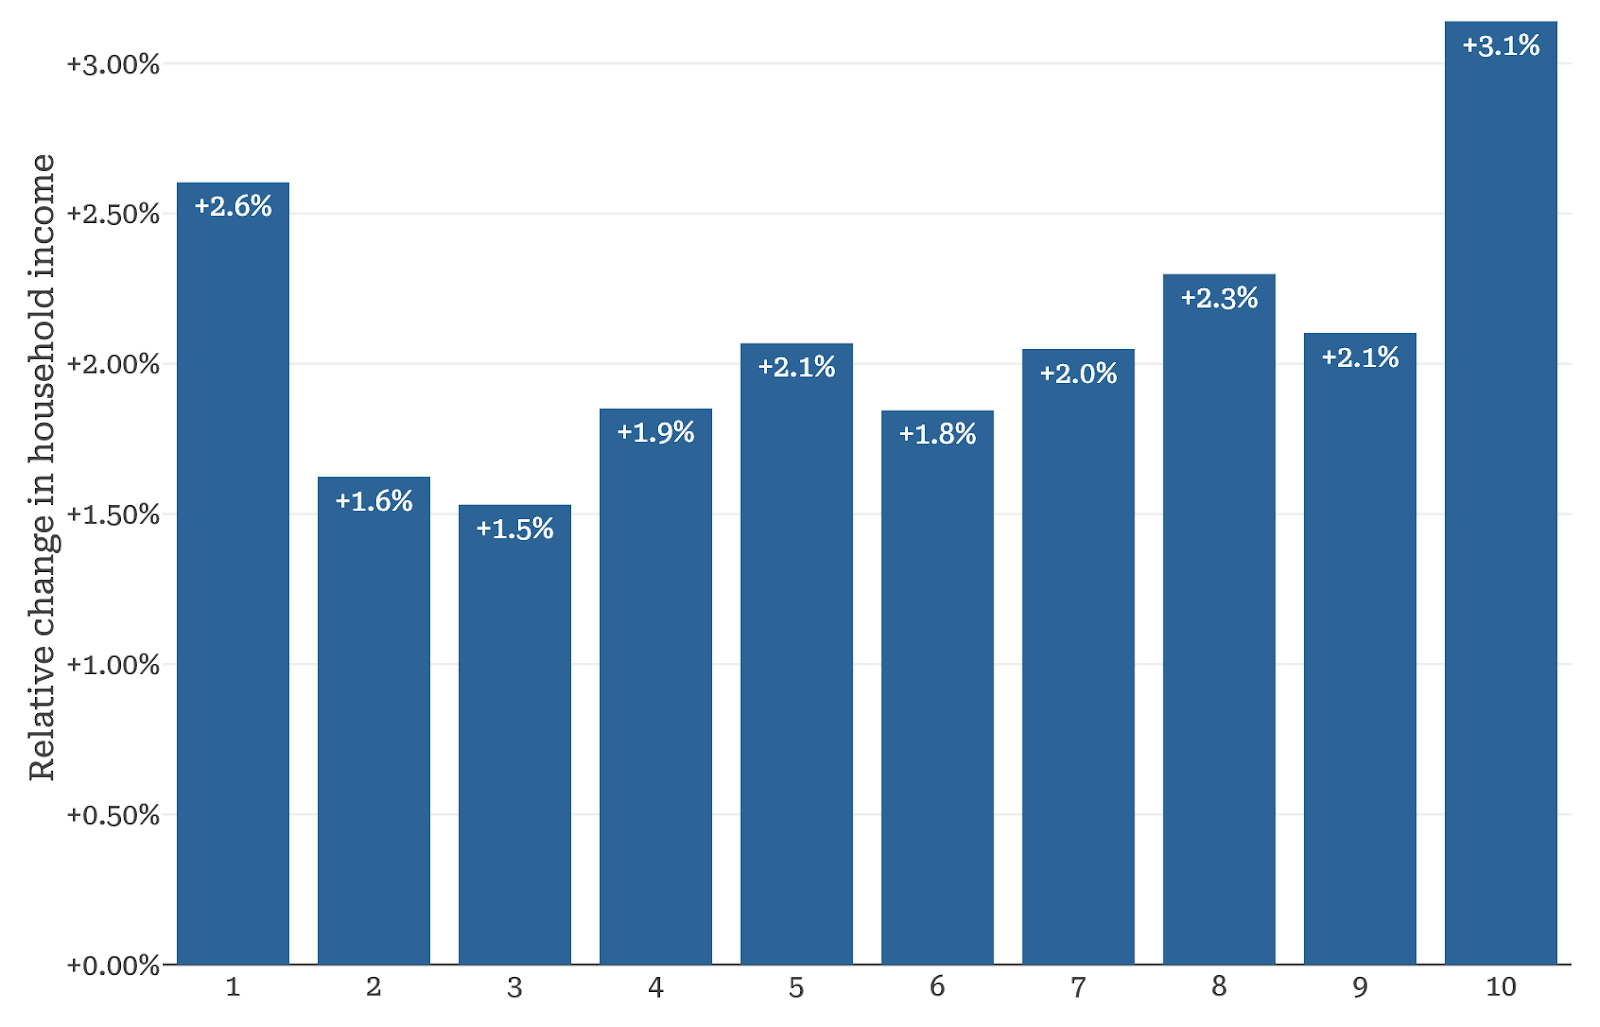
The bill would increase the net income of the top decile by 3.1% on average, the largest gain across deciles.
Figure 7: Average Relative Household Impact of the Income Tax Provisions in the OBBB (2026)
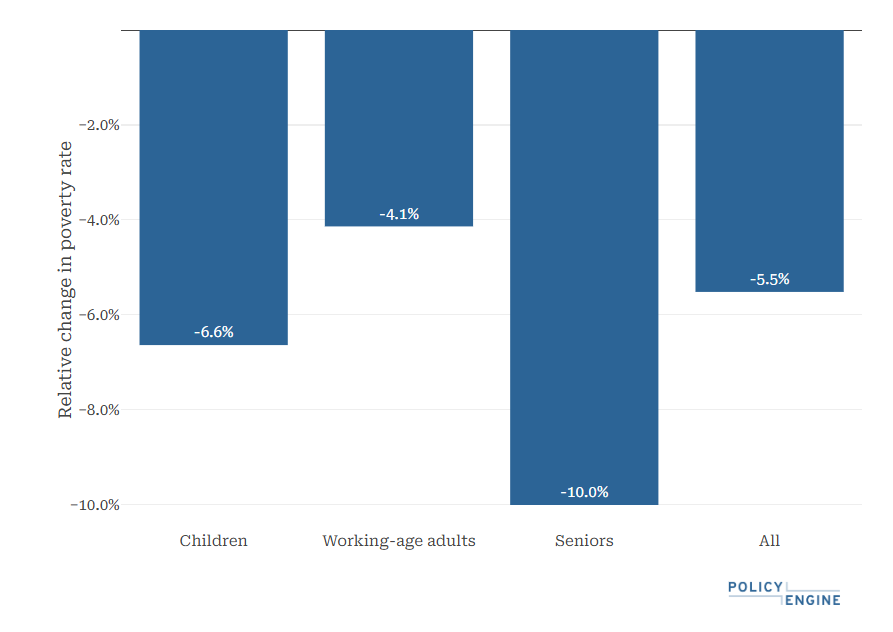
The OBBB tax provisions would reduce poverty and deep poverty by 5.5% and 6.1%, respectively. The age group with the largest reduction in poverty would be seniors at 10%, while child poverty would fall by 6.6%, mainly attributable to the increased CTC.
Figure 8: Poverty Impact of the Income Tax Provisions in the OBBB (2026)
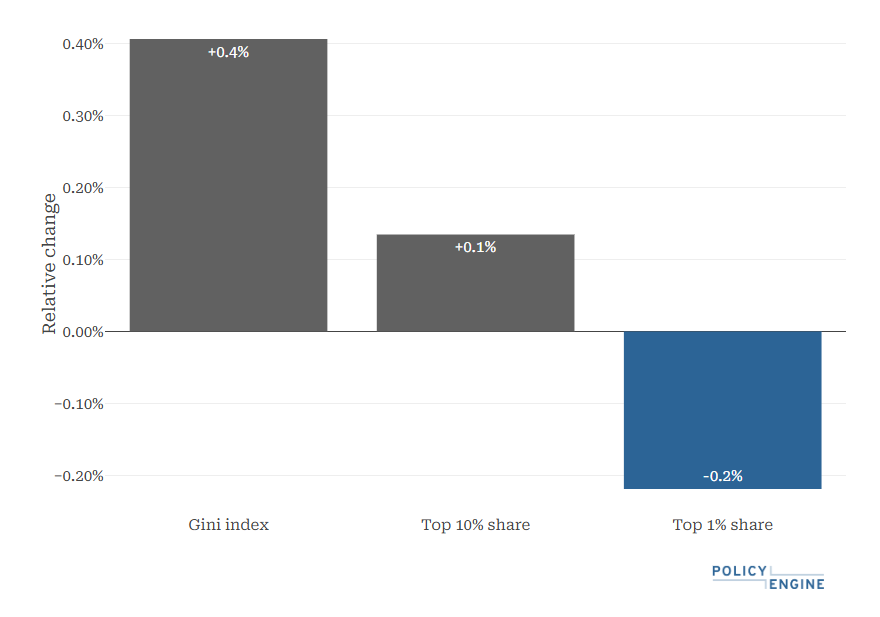
In terms of income inequality, the income tax provisions would increase the Gini index by 0.4% in 2026. Furthermore, the bill increases the top 1%’s net income by 1.9%, less than the overall 2.6%, reducing their share of net income would fall by 0.2%.
Figure 9: Inequality Impact of the Senate Tax Provisions in the OBBB (2026)
Conclusion#
The individual income tax reforms as part of HR 1 would cost $3.8 trillion over the 2026–2035 budget window. Considering the state and local effects, we project the bill to benefit 76% of American residents and reduce net income for 8% of the population; the top income decile gains most on an absolute and relative basis. HR 1 would reduce poverty by 5.5% in 2026, while increasing the Gini index of inequality by 0.4%.
As policymakers evaluate reforms such as these, analytical tools like PolicyEngine offer critical insights into the impacts on diverse household compositions and the broader economy.
We invite you to explore our additional analyses and use PolicyEngine to calculate your own tax benefits or design custom policy reforms.
Appendix 1: Summary of Provisions#
*Indexed for Inflation
-
The May bill text adjusts the year at which the 35% tax bracket is uprated changing it from 2017 to 2016, thereby raising the bracket threshold higher than previously. ↩
-
In 2029, the maximum value of the CTC would drop as the temporary $500 boost expires. However, since the CTC is adjusted for inflation afterwards using 2024 as the base year, the credit’s value would fall to $2,200 rather than $2,000. ↩

Research Analyst at PolicyEngine

Economist at PolicyEngine