
How carbon tax and dividend policies affect UK households
PolicyEngine analysis of £100/200 per tonne carbon taxes with full dividend redistribution shows approximately 71% of UK residents would gain.

Contents
Carbon tax revenue
Distributional analysis
£100/tonne carbon dividend:
£200/tonne carbon dividend:
Winner-loser analysis
£100/tonne carbon dividend:
£200/tonne carbon dividend:
Poverty impact analysis
Inequality impact analysis
Constituency-level analysis
£100/tonne carbon dividend:
£200/tonne carbon dividend:
Areas with largest gains and losses
Conclusion
This report examines how carbon tax and dividend policies would affect UK households under two scenarios: £100 and £200 per tonne of CO2. We analyse how carbon prices impact household incomes when all tax revenue is returned as equal dividends to every resident.
In this policy experiment, the government applies carbon taxes at £100 and £200 per tonne of CO2 equivalent, generating revenue based on emissions and consumption patterns. We calculate average household net income under baseline conditions (no carbon tax) and reform conditions (with carbon tax). The government redistributes all tax revenue as equal per-person dividends to UK residents. We categorise household income changes by gain and loss thresholds and analyse distributional effects across income deciles.
Carbon tax revenue#
The following table presents the total revenue generated from carbon taxation under each scenario in 2026-27:
The Department for Environment, Food & Rural Affairs reports greenhouse gas emissions associated with consumption in 2022 at 740 MtCO2e. At the rate of £100/tonne, the revenue estimation in 2022 would be £74 billion.
For the following analysis, we assume that revenue generated from the carbon tax is redistributed amongst people at a flat rate per person as a carbon dividend.
Distributional analysis#
This section examines how carbon dividend policies affect households across the income distribution, showing relative changes in household income by income decile. Figures 1 and 2 show the percentage change in household income by income decile for each scenario in 2026-27:
£100/tonne carbon dividend:#
Figure 1: Change in household income by income decile
£200/tonne carbon dividend:#
Figure 2: Change in household income by income decile
As shown in Figures 1 and 2, income deciles 1-6 consistently gain from the carbon dividend policy across both scenarios. The magnitude of gains decreases with income level, with decile 1 households seeing the largest improvements. Income deciles 8-10 experience net losses. The £200/tonne rate approximately doubles both the gains for lower deciles and losses for higher deciles compared to the £100/tonne rate.
Winner-loser analysis#
This section analyses the population distribution across different income change categories, showing what proportion of households gain or lose under each scenario. At both levels, 71% of UK residents would benefit financially on a net basis, while 28% would pay more in the carbon tax than they receive in the dividend. Figures 3 and 4 display the distribution of households by income change category for each scenario in 2026-27:
£100/tonne carbon dividend:#
Figure 3: Distribution of households by income change
£200/tonne carbon dividend:#
Figure 4: Distribution of households by income change
As illustrated in Figures 3 and 4, the distribution indicates that lower income deciles have a higher proportion of households gaining more than 5%, while higher income deciles are more likely to experience losses.
Poverty impact analysis#
This section examines how carbon dividend policies affect poverty rates across different demographic groups. Poverty is measured as absolute before housing costs. The following table shows the relative change in poverty rates by demographic group for each scenario in 2026-27:
The carbon dividend policy shows poverty-reducing effects across all demographic groups, with the largest improvements for children at £200/tonne (-0.7%). The £200/tonne rate produces more poverty reduction.
Inequality impact analysis#
This section analyses how carbon dividend policies affect income inequality using standard inequality measures. The following table presents the relative change in inequality measures for each scenario in 2026-27:
The analysis shows that the Gini coefficient decreases by 0.2% at £100/tonne but increases by 0.4% at £200/tonne. The income share of the top 10% and top 1% declines under both scenarios.
Constituency-level analysis#
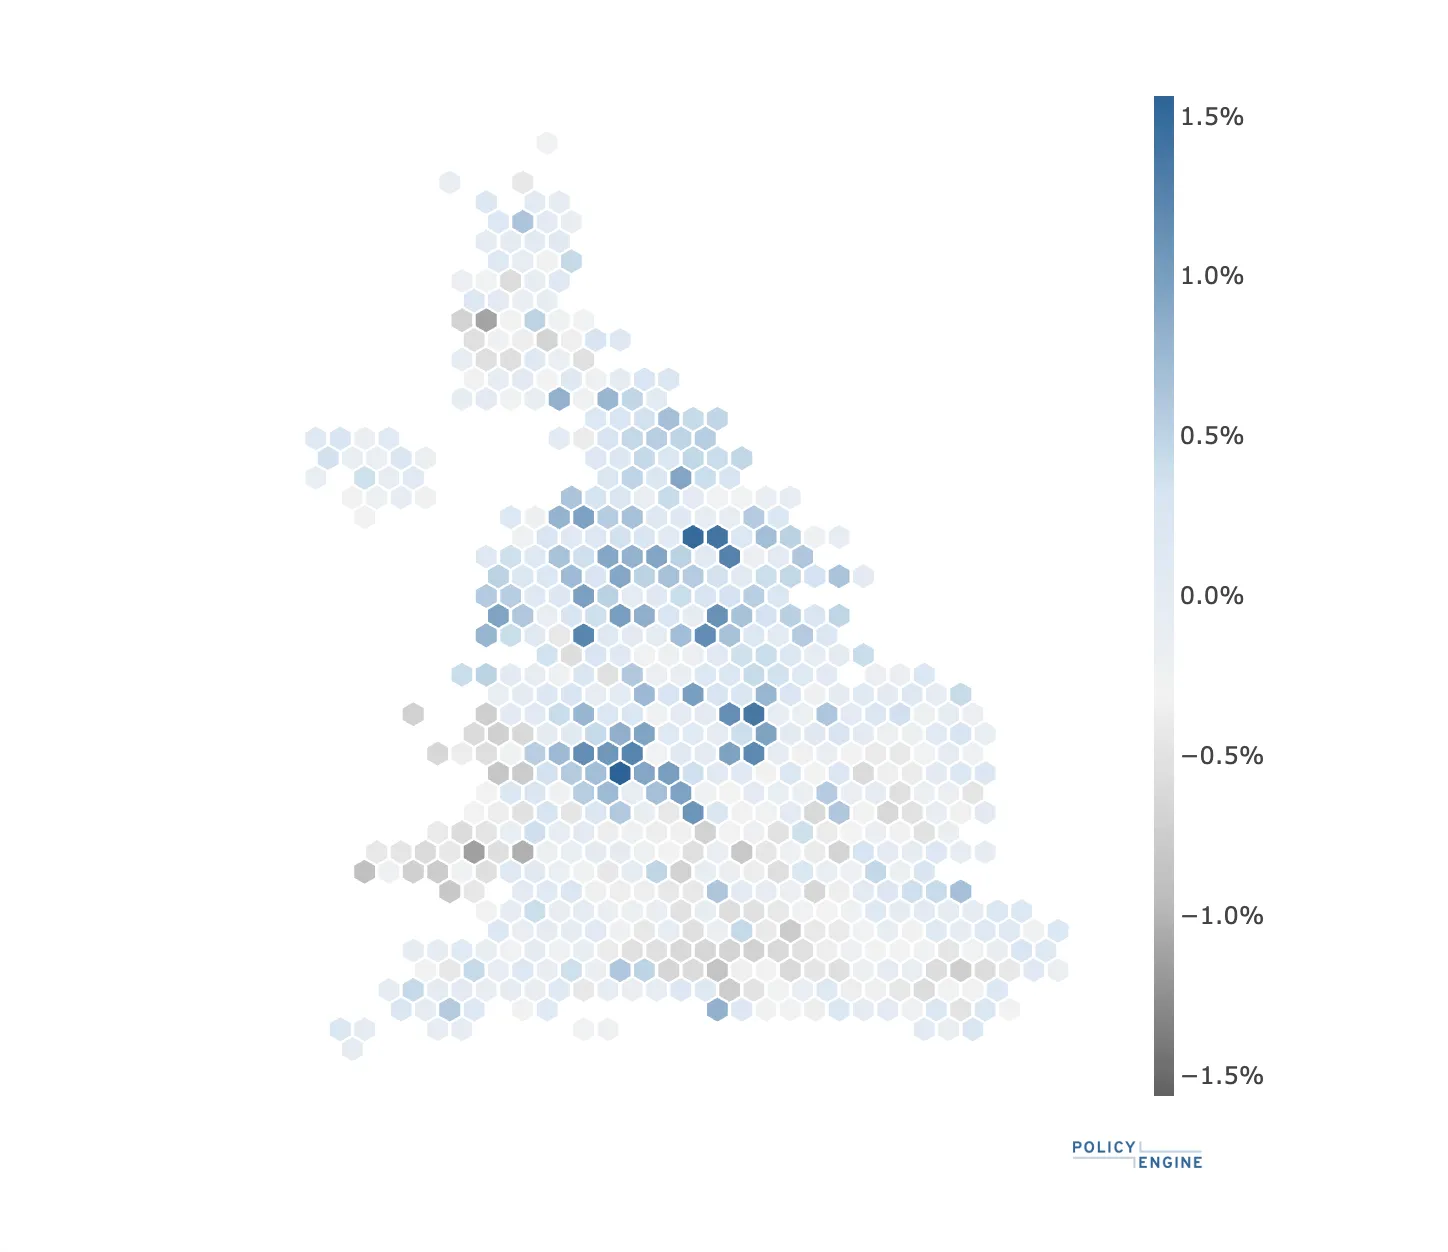
This section presents a geographical analysis of how carbon dividend policies affect different UK constituencies. Figures 5-8 illustrate the distribution of income changes across UK constituencies for each scenario in 2026-27.
£100/tonne carbon dividend:#
The £100/tonne carbon dividend shows geographically concentrated benefits, with urban constituencies experiencing the largest gains.
Figure 5: £100/tonne carbon dividend constituency map
The regional breakdown shows that England benefits most from the £100/tonne carbon dividend, while Wales faces losses across all constituencies.
Figure 6: Constituency distribution by region
£200/tonne carbon dividend:#
The higher carbon tax rate amplifies the geographical patterns, with more constituencies experiencing gains.
Figure 7: £200/tonne carbon dividend constituency map
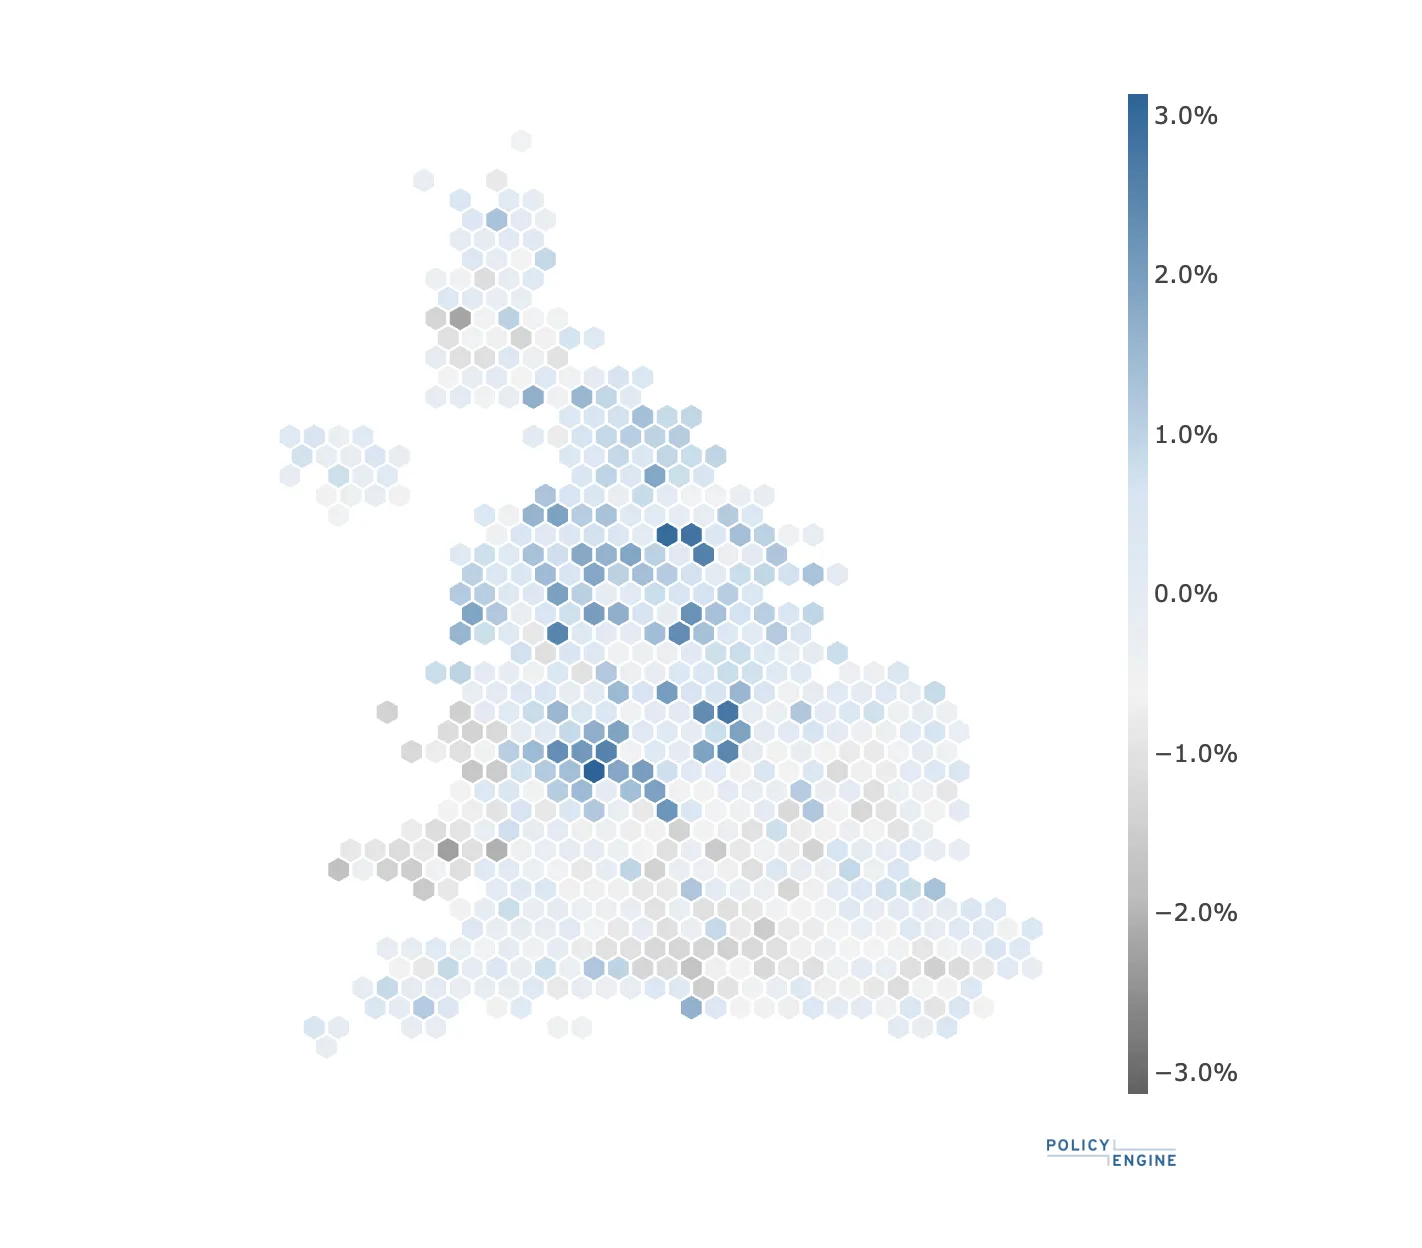
At the £200/tonne rate, 294 constituencies gain compared to 265 at the £100/tonne rate, with 60 constituencies showing no change.
Figure 8: Constituency distribution by region
The constituency analysis shown in Figures 5-8 reveals geographical variation in policy impacts. Wales consistently shows negative impacts, with all 32 constituencies experiencing losses in both scenarios. England shows the greatest number of benefiting constituencies, with 245 gaining at £100/tonne and 269 gaining at £200/tonne. Scotland shows mixed results with 13-18 constituencies gaining, while Northern Ireland has 7 constituencies gaining under both scenarios.
Areas with largest gains and losses#
The constituencies experiencing the largest gains (as a share of net income) include urban areas such as Birmingham Ladywood, Bradford West, Bradford East, Nottingham East, and Leeds South. Conversely, constituencies in Wales and affluent areas face the largest losses (as a share of net income), including Monmouthshire, Cardiff North, and Vale of Glamorgan. This geographical variation reflects differences in local income distributions and carbon consumption patterns across UK constituencies.
Conclusion#
Our analysis shows that carbon dividend policies would benefit approximately 71% of UK residents across both £100/tonne and £200/tonne scenarios in 2026-27. The £100/tonne rate would reduce poverty by 0.3% overall, while the £200/tonne rate would reduce poverty by 0.5% overall.
Lower-income households in deciles 1-6 would see net income gains under both scenarios, while higher-income households in deciles 8-10 would experience net losses. The geographic distribution reveals 265 constituencies gaining at £100/tonne and 294 at £200/tonne in 2026-27.
We invite you to explore the PolicyEngine webapp to model your own customised carbon tax and dividend reforms.

Research Associate at PolicyEngine