
How machine learning tools make PolicyEngine more accurate
Today, we're launching new survey weights that cut deviations from administrative statistics by 97%.

Contents
Standard accuracy improvements fell short
Enter: gradient descent
Tuning the model
Results
Where we go from here
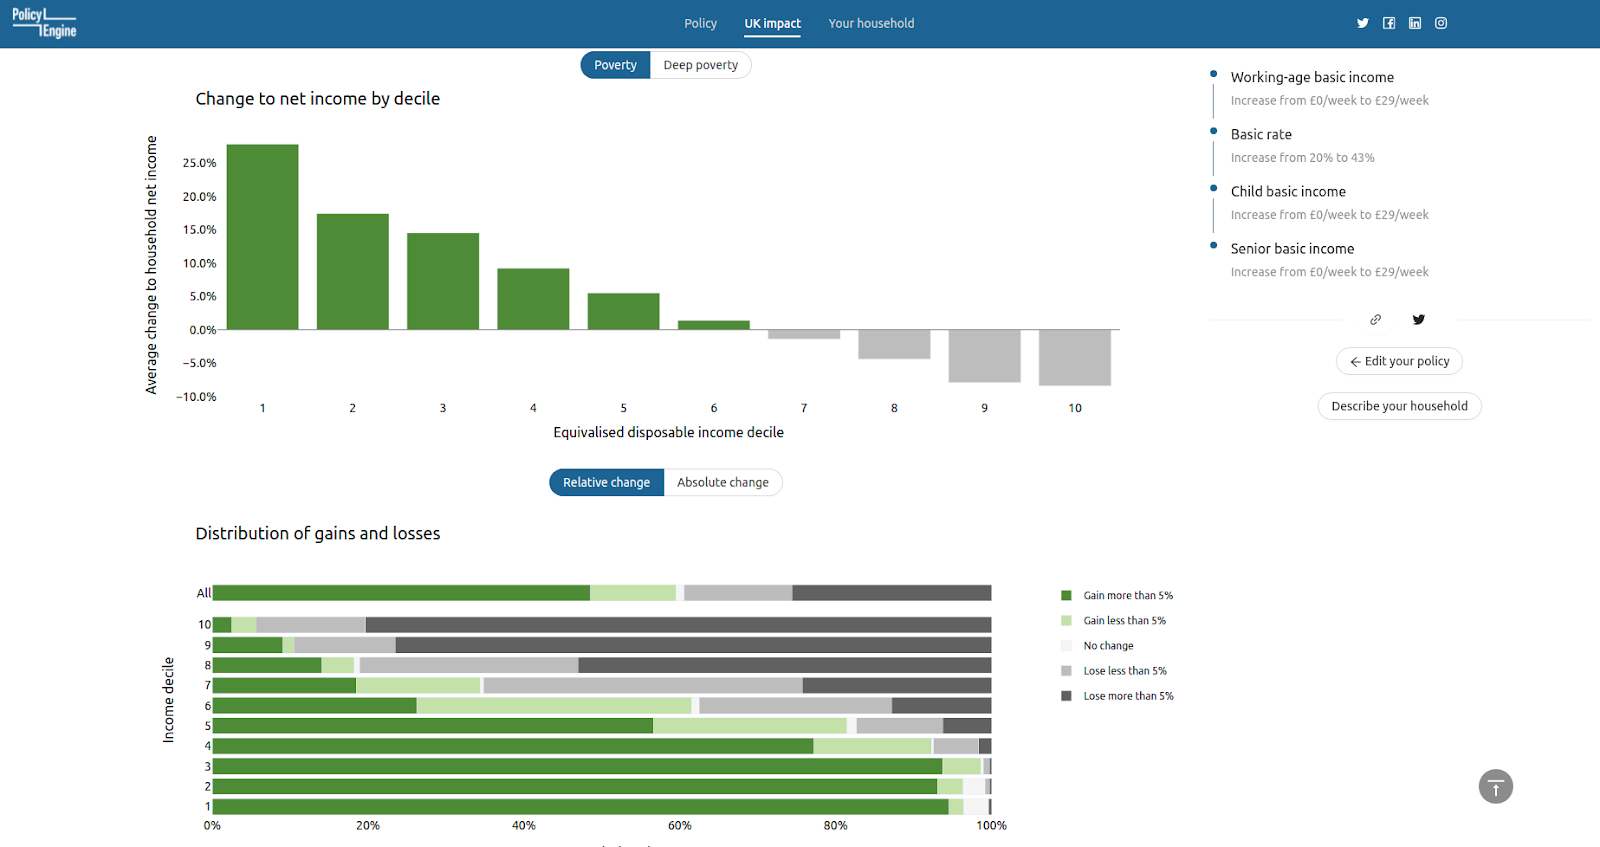
When you click “Calculate UK impact” in PolicyEngine, our servers run through tens of thousands of UK households, and for each one, they crunch how your policy affects taxes and benefits. Each of those households in turn represents hundreds or thousands of real UK households, such that adding them up produces measures like budgets, poverty, and inequality. By the time the UK impact screen loads, we’ve calculated each of those measures under your policy, compared it to baseline policy, and summarised the results into charts and graphs.
This technique is called microsimulation, and its heart is a representative survey — that set of tens of thousands of households. Like five of the six other UK microsimulation models, we use the Family Resources Survey produced by the Department of Work and Pensions. The DWP releases a new FRS each year (the latest is for 2019–20), and reports demographic variables like age, location or disability, as well as financial variables like earnings, benefit receipt or pension income.
Standard accuracy improvements fell short#
From the start, we’ve adjusted the FRS to make it more useful for microsimulation. Like other microsimulation models, we’ve:
-
Replaced reported tax and benefit values with our calculations (for benefit participants)
-
Uprated population and income from 2019–20 to 2022 using government projections
-
Assumed that some households claim benefits when eligible, even when they don’t report claiming them, according to government estimates of take-up rates
-
Moved households from legacy benefits to Universal Credit according to roll-out rates
However, even our adjusted FRS failed to match administrative totals on a variety of measures. For example, Income Tax revenue in 2019 was £165bn in the model, compared to £190bn by administrative statistics. Across benefit programs, we were often off by between 10% and 40%.
Two possible issues explained our remaining discrepancies:
-
Measurement error, in which FRS respondents misreport their financial situation
-
Sampling error, in which FRS households misrepresent UK households
As we dug further, we found that for many benefits, we could adjust take-up rates to either match official expenditure or official caseloads, but not both. This situation can only occur if the households claiming a benefit in the model are fundamentally different from the households claiming the benefit in reality. So, having exhausted our options to address measurement error, and with evidence on hand that the survey was unrepresentative of the population, we turned to sampling error.
Specifically, we questioned the household weights: the number of real-world households a given FRS respondent represents. DWP assigns weights by a multi-stage process:
-
Randomly sampling postcode addresses (approximately one in 650). If surveyors find multiple households at an address, they select one and adjust the weight.
-
Calibrating weights to match administrative statistics for the following metrics (with slight variations).
These calibrations included targeting metrics like:
-
Age group-sex-region bins (for example, the number of men aged 30 to 39 in London)
-
Population counts by region, tenure type and council tax band
Could we do better?
Enter: gradient descent#
To find the “best” weights for the FRS, we first need to define what we mean by “best”. To do this, we define a loss function, which reduces an array of household weights into a single number (the loss): the lower, the better. We then apply an optimisation procedure to find the array of weights that minimises this loss function.
We compute our loss function as follows:
-
For each of 1,512 targets, compute the squared relative error. For example, the FRS estimates Housing Benefit to be £13.6bn, while the administrative total is £18.4bn; the initial squared error for this target would be ((13.6–18.4)/18.4)²=0.068.
-
Multiply each squared relative error by the baseline target, so as to weigh larger targets more.
-
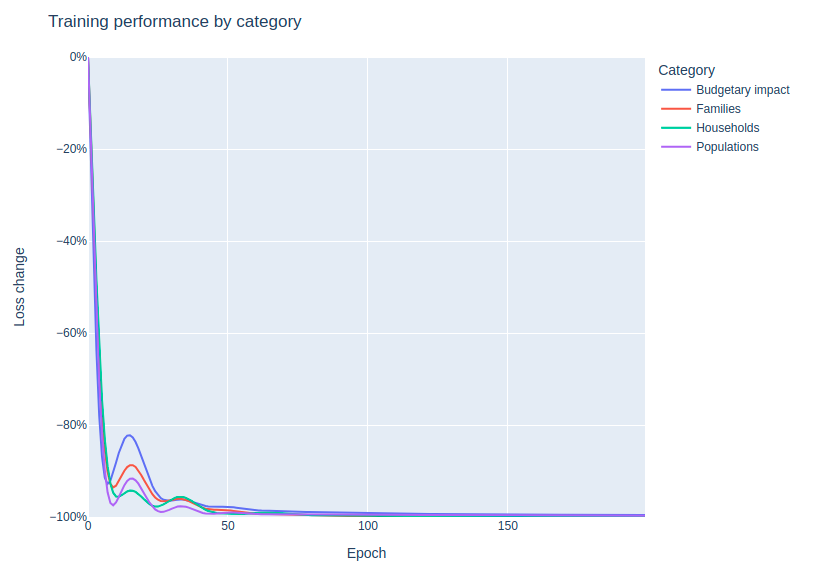
Assign each target to one of four categories: populations, families, households, or budgetary impacts, according to their unit. For each category, compute the log of the change to percent error against the baseline.
-
Compute the final loss as the average log percent error across each category, with half of the total weight going to budgetary impacts and the other half on the other categories. That is, we value a 50% improvement in the loss for budgetary impact statistics the same as a 50% improvement in the combined loss for population, family and household statistics.
Having constructed our loss function, we can adjust the weights to minimise the loss via gradient descent:
-
For each survey household, calculate the gradient of the loss function with respect to the household’s weight. This is the extent to which the total loss metric would increase if the household’s weight increased: if the gradient with respect to a household is positive, then increasing the weight would worsen accuracy, and vice versa. The larger the absolute gradient is, the more adjusting a household’s weight affects the loss function.
-
Multiply the gradient by a small number, called the learning rate, and subtract it from the initial vector of weights to create a new set of weights.
-
Recompute the loss with the new weights.
-
Repeat steps 1–3, which constitute an epoch, until some stopping criterion is met.
Tuning the model#
As with other machine learning models, this iterative approach risks overfitting–that is, we might over-optimise for the measures in the loss function, at the expense of other measures we haven’t yet included. Machine learning models often reserve a set of records to validate their predictions on, and tune hyperparameters (e.g., learning rate and number of epochs) to avoid overfitting on the training data at the expense of these out-of-sample predictions. Our analogy to that is reserving a set of validation targets.
Specifically, we trained our model five times, each time reserving 20% of the targets for validation, and training on the other 80%. Each 20% was exclusive of the others, such that all metrics were validated against in one of the five validation runs.
Averaging over the five runs showed that gradient descent continues to reduce total loss (training plus validation metrics) for at least 200 epochs.
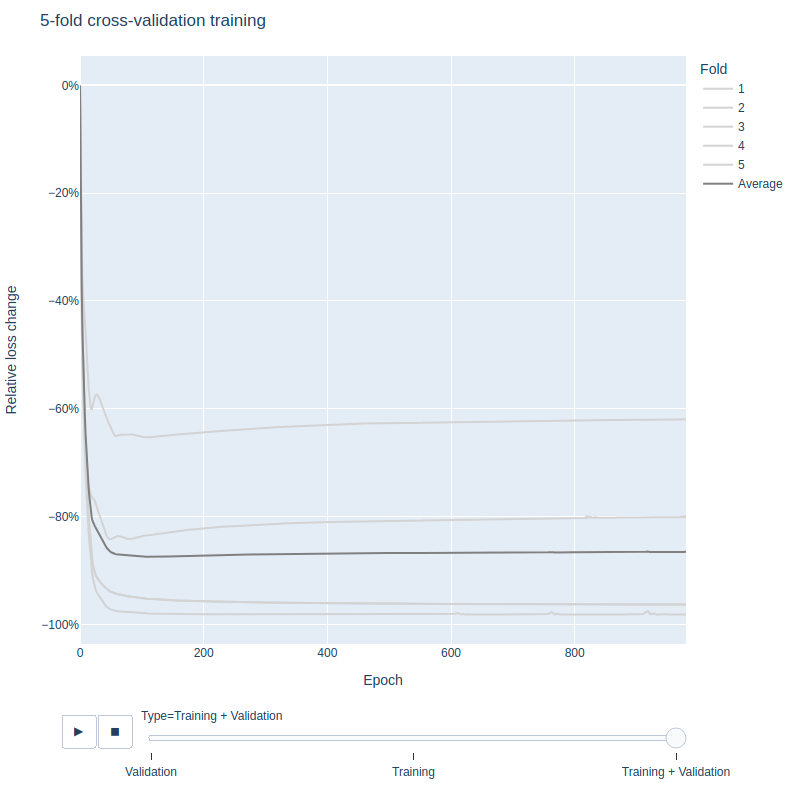
Based on these results, we chose to produce the final weights by training again with all the targets in the loss function, stopping at 200 epochs.
Results#
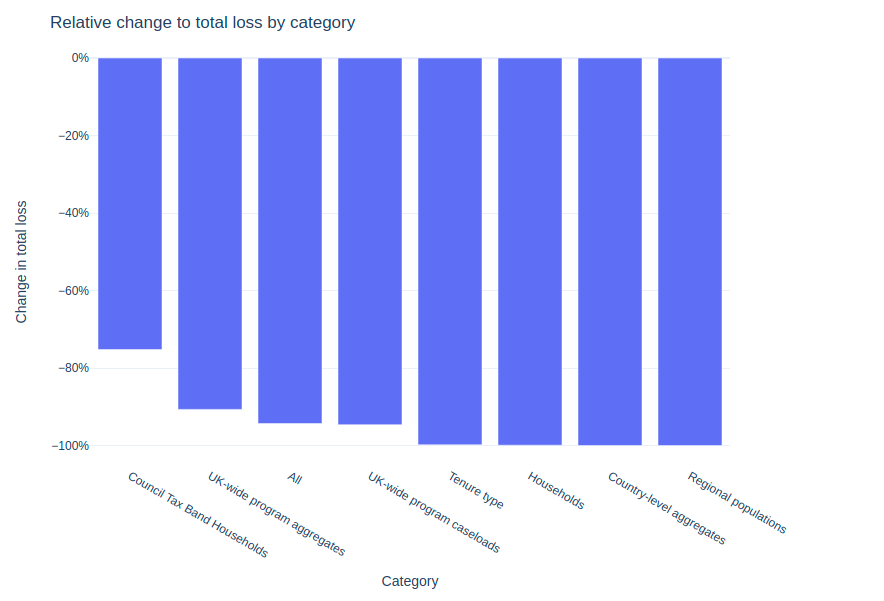
Our procedure reduced the total loss by 97%, with the regional populations and country-wide budgetary impact categories seeing the largest improvements.
Of the six other UK microsimulation models, only UKMOD publishes their aggregates to compare against. We find that our improved weights produce up to 80% lower aggregate and caseload errors on individual programs.
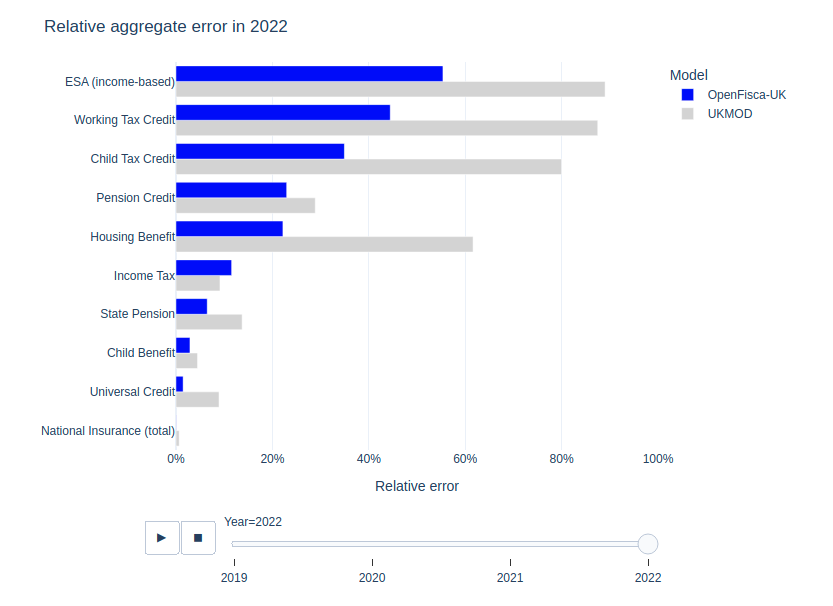
Our relative errors are highest for the smallest benefit programs (those with less than £10 billion annual expenditure), in part because our loss function prioritises larger programs.
Where we go from here#
We’ve published our weights on GitHub for other analysts and microsimulation modellers to use, documented our approach with interactive visualisations, and effective today, updated PolicyEngine UK to use the new weights. In the future, we’ll refine and extend our weights with more targets, mid-year adjustments, and multi-year extrapolations.
We will also continue to develop other ways of enhancing PolicyEngine with state-of-the-art data science. For example, we are continuing to invest in our machine learning-based synthimpute technology to fuse variables from other surveys, such as wealth from the Wealth and Assets Survey and consumption from the Living Costs and Food Survey, to model a broader range of policy reforms.
We’re excited to explore other ideas for improving public policy analysis with technology, and welcome any other modellers to reach out with feedback or ideas.

PolicyEngine's Co-founder and CTO