
High value council tax surcharge: revenue by constituency
We estimate the surcharge raises £410 million in 2028-29 from owner-occupied main residences in England before behavioural responses, 39% of it from 10 constituencies.
Contents
The policy
Revenue by constituency
Where homes worth over £2 million are
National revenue
Who pays
Support for owners on lower incomes
Data
Years and values
Privacy
Uncertainty
At the November 2025 Budget, the government announced a high value council tax surcharge on homes in England worth £2 million or more. The Office for Budget Responsibility (OBR) estimates that it raises £605 million in 2028-29 before behavioural responses and £400 million after them.
We estimate the surcharge's revenue in each Westminster constituency in 2028-29, and for England to 2030-31, with Microcosm UK, PolicyEngine's microdata on households and their homes in every local area. Microcosm combines the Family Resources Survey, HMRC's Survey of Personal Incomes and the Wealth and Assets Survey, and takes home values from HM Land Registry sale prices. These are experimental modelled estimates with wide uncertainty, not official statistics.
Key findings for 2028-29:
- The surcharge raises £410 million from owner-occupied main residences, before behavioural responses.
- Ten constituencies, eight of them in London, raise 39% of the revenue.
- The top income quintile pays 65% of the revenue; each of the bottom three pays about 7%.
- A support scheme for payers with net income under £30,000 would cut revenue by 14% at 75% take-up.
Explore the interactive map | Download the data
The policy#
Under the government's policy paper, owners of homes in England pay the surcharge from April 2028 on top of their council tax if the Valuation Office values the home at £2 million or more in 2026 prices. Owners, rather than occupiers, are liable, and councils collect the surcharge for central government. The charges rise with consumer prices index (CPI) inflation from 2029-30, and homes keep their 2026 values until the next revaluation in 2033, according to the government's consultation. An owner whose home is valued at £2.8 million, for example, pays £3,500 in 2028-29.
Revenue by constituency#
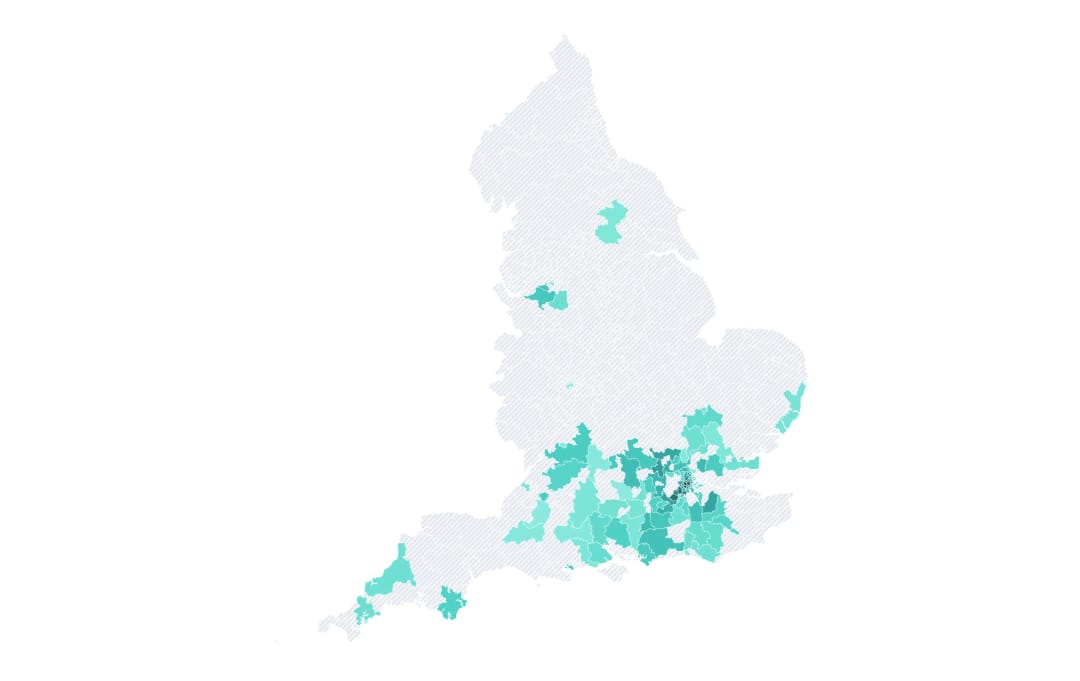
We report estimates for 110 of England's 543 constituencies, which hold about 90% of England's homes worth over £2 million in counts we derive from Land Registry sale prices, including all 50 constituencies with the most such homes. The other 433, hatched grey on the map, have fewer than 10 survey households with homes over £2 million behind their estimates. Constituency estimates are uncertain: for a typical constituency shown, the standard error is about 38% of the estimate, though the ranking of those with the most revenue is steadier.
The 10 constituencies with the most revenue account for £159 million, and the 20 with the most for 53% of the total.
Where homes worth over £2 million are#
London and the South East hold 79% of England's owner-occupied homes worth over £2 million. Across constituencies, the estimates follow the Valuation Office's count of band H homes, the highest council tax band, with a rank correlation of 0.77.
Share of England's owner-occupied homes worth over £2 million, by region
2028-29, homes at 2026 values. Regions with enough survey data to report.

National revenue#
We estimate the surcharge raises £410 million in 2028-29, rising to £430 million in 2030-31 as charges rise with inflation and household numbers grow. Our estimate covers about 127,000 owner-occupied main residences. The OBR's tax base of 165,000 properties also includes second homes and let or company-owned properties. How many liable homes are owner-occupied is uncertain: the OBR's stamp duty data put about 40% of them as not owner-occupied, leaving about 99,000, while the Market Value Survey cited in the government's consultation found over 90% owner-occupied, about 150,000. Our estimate falls between the two.
Neither our estimates nor the OBR's static figures include behavioural responses. In the OBR's costing, price effects, non-payment, appeals, the support scheme and effects on other taxes reduce revenue in 2028-29 by £205 million, about a third.
Who pays#
We rank households by net income after taxes and benefits, adjusted for household size, and split them into five quintiles that each hold a fifth of people; the bottom quintile includes households with negative incomes. The top quintile pays 65% of the surcharge. Each of the bottom three quintiles pays about 7%: some owners of homes worth over £2 million have low incomes, and the surcharge depends only on the home's value.
Share of surcharge revenue by household income quintile, 2028-29
Households ranked by net income after taxes and benefits, adjusted for household size
Support for owners on lower incomes#
The OBR's costing assumes that households with net income under £30,000 a year can use a support scheme, that 75% of them take it up, and that this reduces revenue by 9%. In our data, these payers make up 19% of payers and pay 19% of the revenue, so 75% take-up would reduce revenue by 14%. The OBR's 9% applies to revenue from all liable properties, including those not owner-occupied, so the two figures measure different bases.
The government's consultation proposes deferral for owners with household income of £35,000 or less and savings of £16,000 or less, and for homes that are the main home of a disabled or severely mentally impaired person. We do not model those criteria.
Methodology and limitations
Data#
We use the data and model that policyengine 6.10.0 pins: Microcosm UK's 2024-25 local-area release, with 150,000 households, and PolicyEngine's UK tax-benefit model, policyengine-uk 2.132.6, which defines the surcharge. Household incomes come from policyengine-uk 2.122.2. PolicyEngine has certified the national release built from the same surveys; the local-area release behind these constituency results is not certified.
PolicyEngine calibrates the release to official local statistics, including Land Registry-based counts of owner-occupied homes worth over £1 million, £1.5 million and £2 million by region and local authority. It ranks owners in each region by the home value imputed from the Wealth and Assets Survey, and gives each home the Land Registry sale price at the same percentile in its constituency.
Years and values#
Homes keep their 2026 values in every year. To reach 2026 prices, policyengine-uk uprates 2024 home values with the OBR's forecast growth in GDP per capita, 7.4%; the OBR's house price forecast, 5.3%, would put fewer homes over each threshold. Uprating with GDP per capita puts more homes over £2 million than the Land Registry-based counts Microcosm is calibrated to.
In policyengine-uk, the charges rise with its CPI forecast, 2.0% a year, from 2029-30, while the bands stay at their 2026 values, so the same homes pay in every year. Household numbers grow with the ONS projection of UK population: 1.9% from 2024-25 to 2028-29, then 0.4% in 2029-30 and 0.5% in 2030-31. The OBR instead grows the stock of homes over £2 million with new builds, at 0.4% to 0.6% a year.
Privacy#
PolicyEngine licenses the survey data from the UK Data Service. We report a constituency only if at least 10 survey households with homes over £2 million sit behind its estimate, and every estimate includes keyed noise: we multiply each survey household's weight by a fixed factor between 8% and 12% away from 1, set by a secret key. The noise typically moves a constituency's estimate by a few per cent.
Uncertainty#
We measure uncertainty by resampling the survey households 500 times. The 90% range for England's revenue in 2028-29 runs from £360 million to £480 million, and the later years carry the same uncertainty in proportion. These measures leave out calibration and modelling error, so the true uncertainty is larger. The estimates are static: they assume no change in house prices, sales or compliance, and no appeals or deferral beyond the support scheme calculation.
Analysis by PolicyEngine. The constituency estimates and the code for the map are on GitHub.

Research Associate at PolicyEngine